Fig. 3.
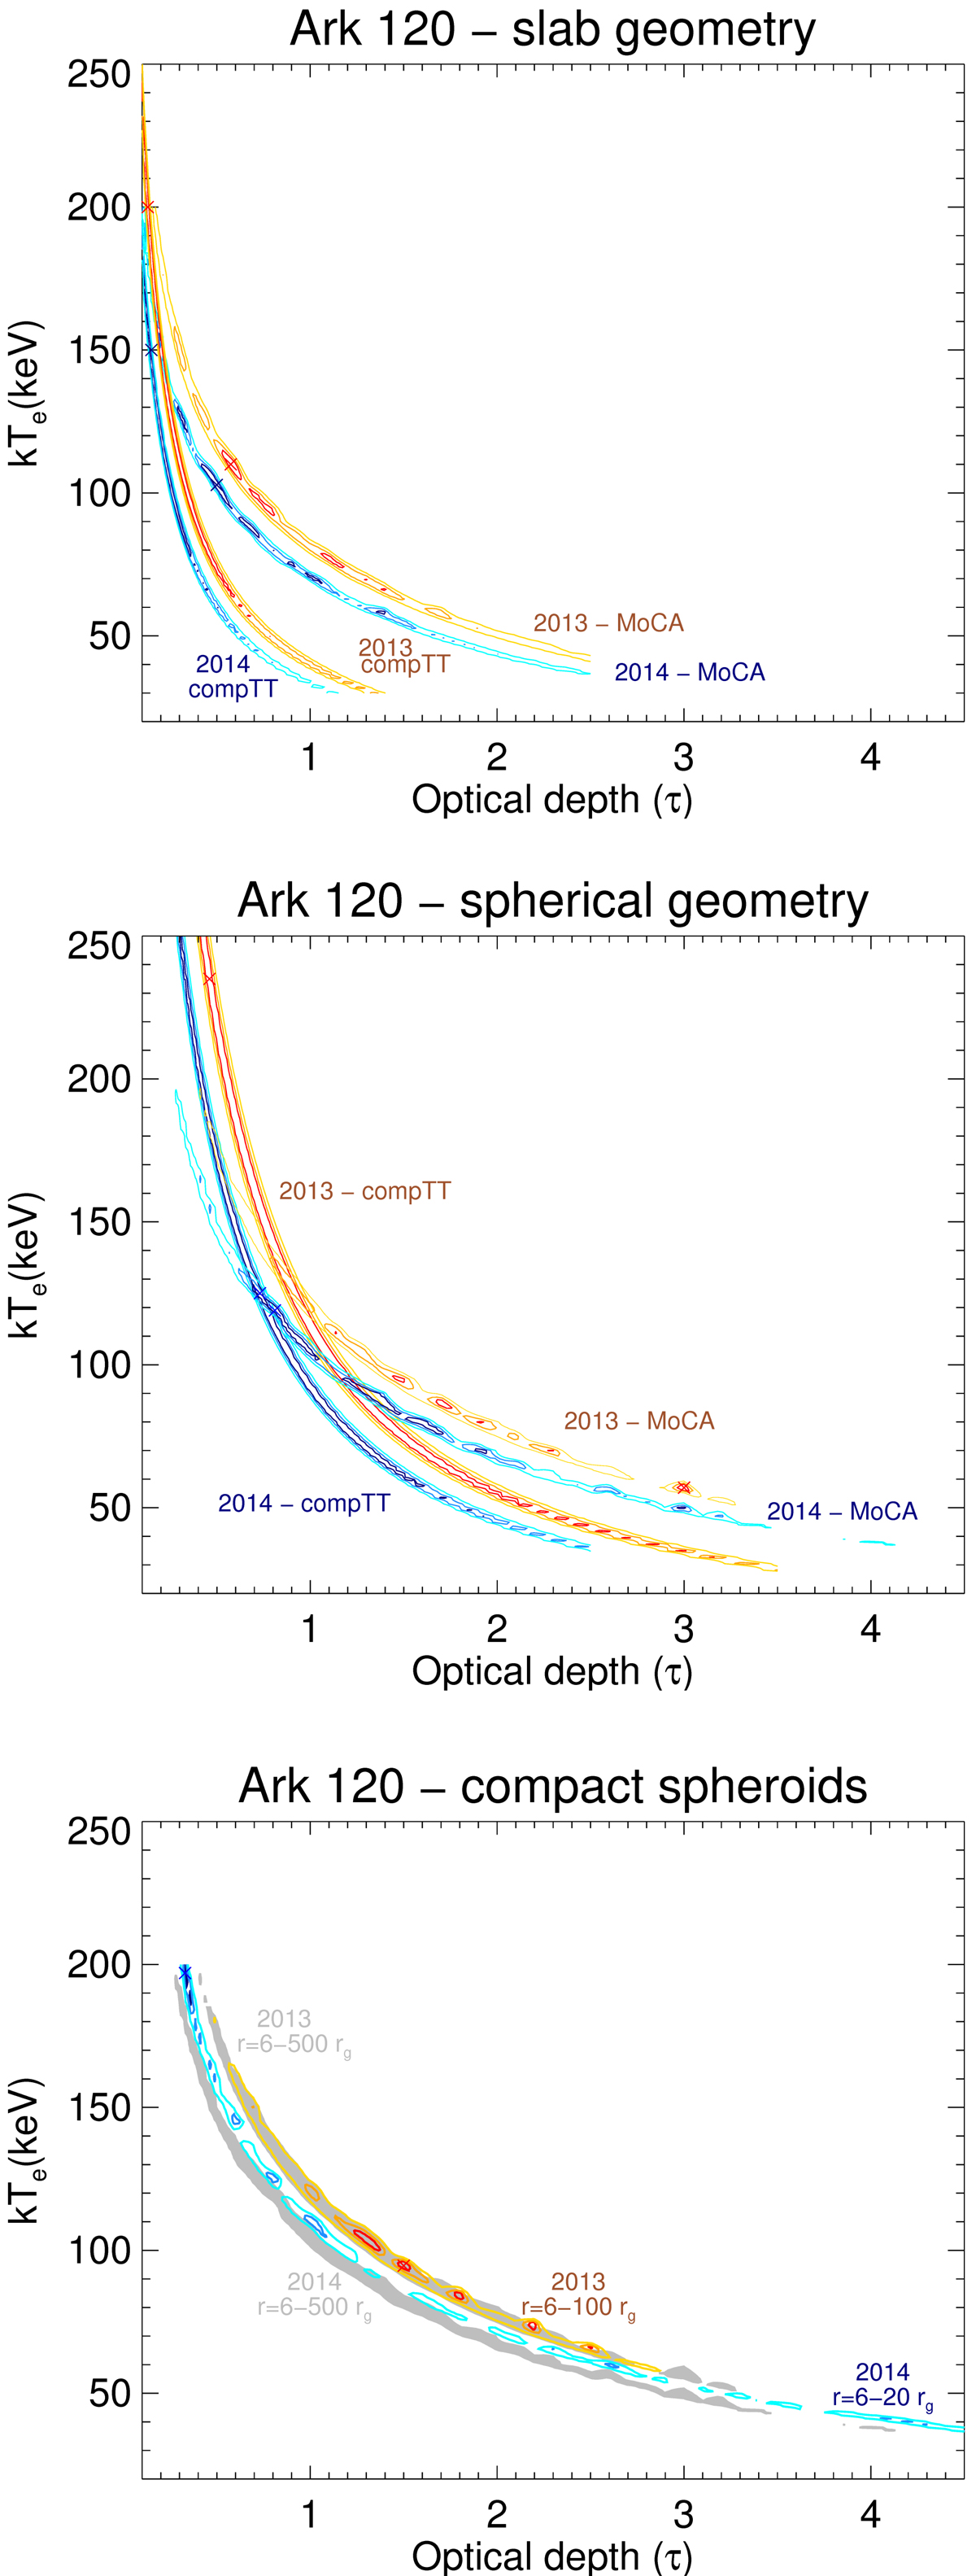
Contour plots between kTe and τ for the slab (left panel), spherical (right panel) and compact spherical coronae (bottom panel) are shown, for the 2013 and 2014 best fits. For the 2013 data set yellow, orange and red contours indicate 99%, 90% and 68% confidence levels. For the 2014 data set cyan, light blue and dark blue contours indicate 99%, 90% and 68% confidence levels, respectively. We show, for the sake of visual comparison, the 99% c.l. contours adopting extended spherical coronae for the 2013 and 2014 observations in gray (bottom panel).
Current usage metrics show cumulative count of Article Views (full-text article views including HTML views, PDF and ePub downloads, according to the available data) and Abstracts Views on Vision4Press platform.
Data correspond to usage on the plateform after 2015. The current usage metrics is available 48-96 hours after online publication and is updated daily on week days.
Initial download of the metrics may take a while.