Fig. 2.
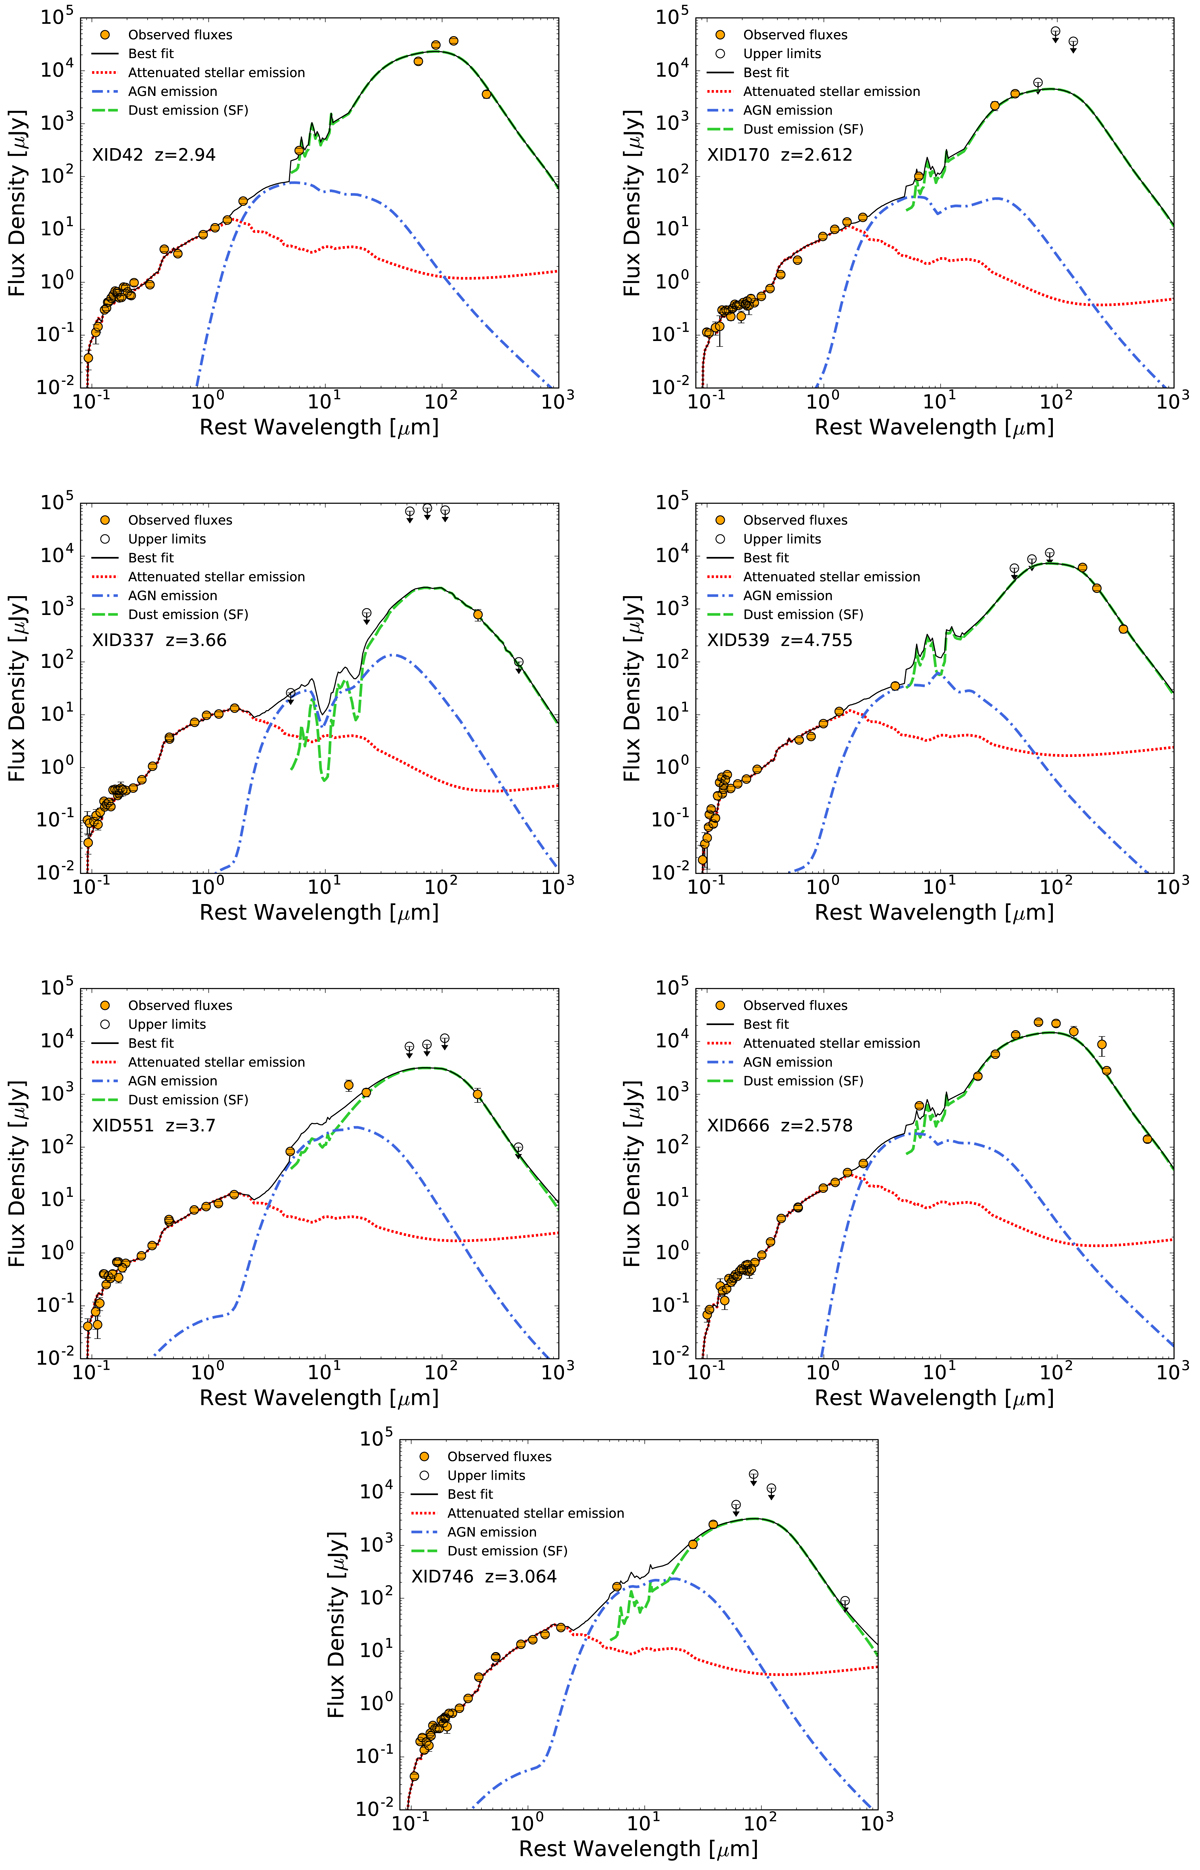
Spectral decomposition of the rest-frame SEDs of the target sample. The X-ray source ID (from Luo et al. 2017) and the redshift are shown in the middle-left part of each panel. The orange filled dots depict photometric data, and empty dots indicate 3σ upper limits. The black solid line is the total best-fit model, the red dotted line represents the stellar emission attenuated by dust, the AGN model is reproduced by the blue dot-dashed line, and the green dashed line accounts for dust emission heated by star formation.
Current usage metrics show cumulative count of Article Views (full-text article views including HTML views, PDF and ePub downloads, according to the available data) and Abstracts Views on Vision4Press platform.
Data correspond to usage on the plateform after 2015. The current usage metrics is available 48-96 hours after online publication and is updated daily on week days.
Initial download of the metrics may take a while.