Fig. 9.
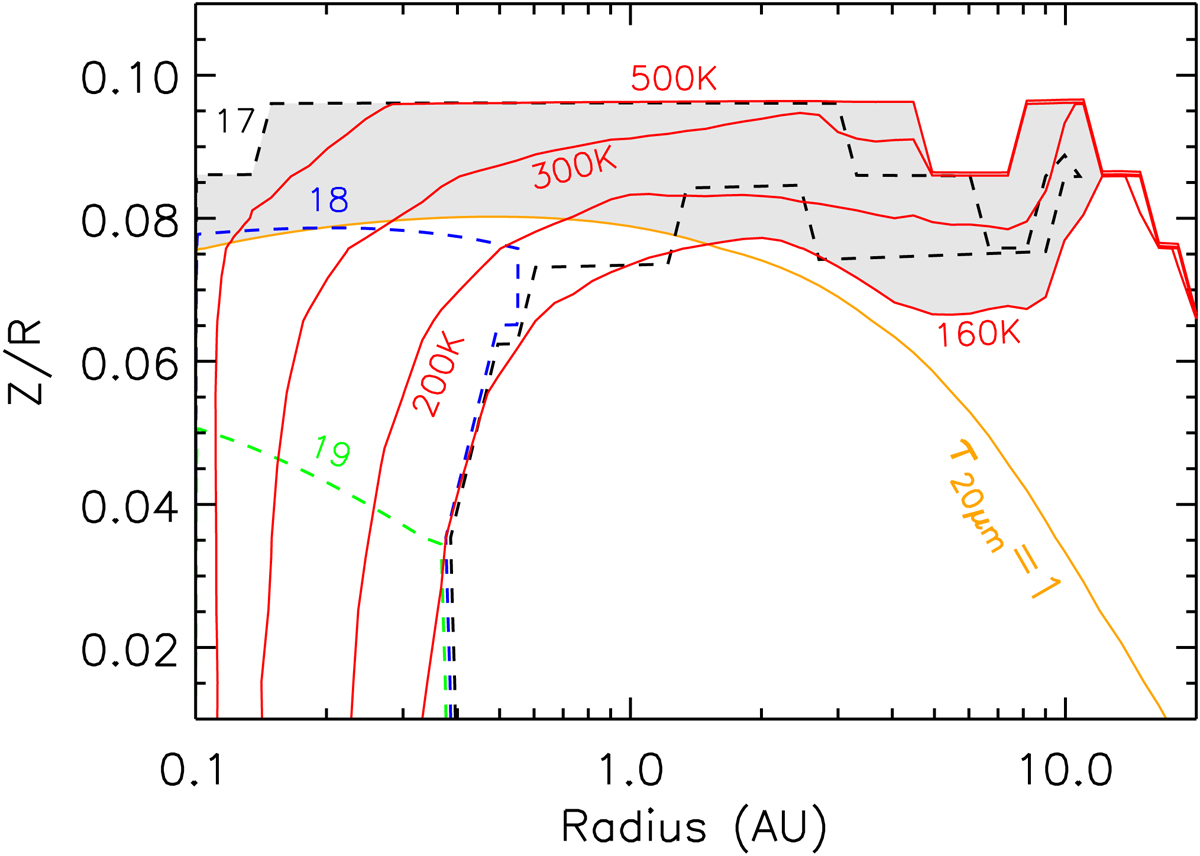
Gas temperature and H2O column density distribution for the reference model. Contours of the gas temperature at 160, 200, 300, and 500 K are shown as red solid lines. The dashed contours refer to the water column density Log (NH2O/cm−2) at 17 (black), 18 (blue), and 19 (green), where NH2O is measured from the surface layer down to the midplane. The orange contour indicates the scale height with dust optical depth τ20 μm = 1 measured from the surface layer to the midplane. The shaded area encloses the contours of Log (NH2O/cm−2) = 17, T = 160, 500 K, and τ20 μm = 1. This region contributes to most of the water vapor emission at mid-IR wavelengths.
Current usage metrics show cumulative count of Article Views (full-text article views including HTML views, PDF and ePub downloads, according to the available data) and Abstracts Views on Vision4Press platform.
Data correspond to usage on the plateform after 2015. The current usage metrics is available 48-96 hours after online publication and is updated daily on week days.
Initial download of the metrics may take a while.