Fig. 8.
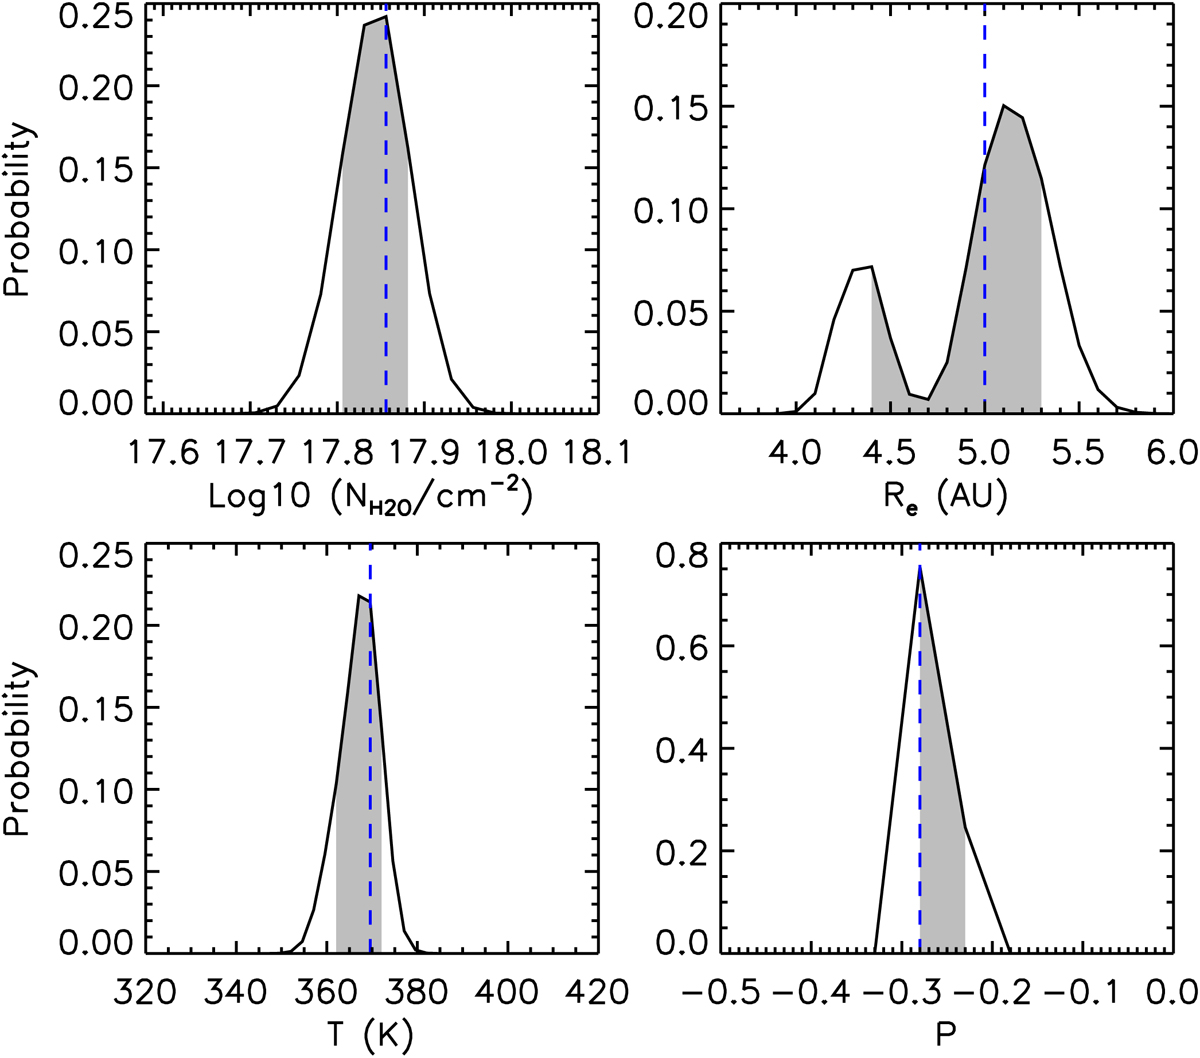
Bayesian probability distributions of the H2O parameters for the fit to the reference spectrum. The abscissa scale in the NH2O and T panels is different here from that in Fig. 3. For the Bayesian analysis, we varied T in steps of 2.5 K, NH2O in logarithmic steps of 0.025, Re in steps of 0.1 AU, and P in steps of 0.05. The step widths for T and NH2O are smaller than those used in Fig. 3 (see Sect. 3.1). These plots show that the strong peaks are not due to an insufficient sampling of the parameters.
Current usage metrics show cumulative count of Article Views (full-text article views including HTML views, PDF and ePub downloads, according to the available data) and Abstracts Views on Vision4Press platform.
Data correspond to usage on the plateform after 2015. The current usage metrics is available 48-96 hours after online publication and is updated daily on week days.
Initial download of the metrics may take a while.