Free Access
Fig. 3.
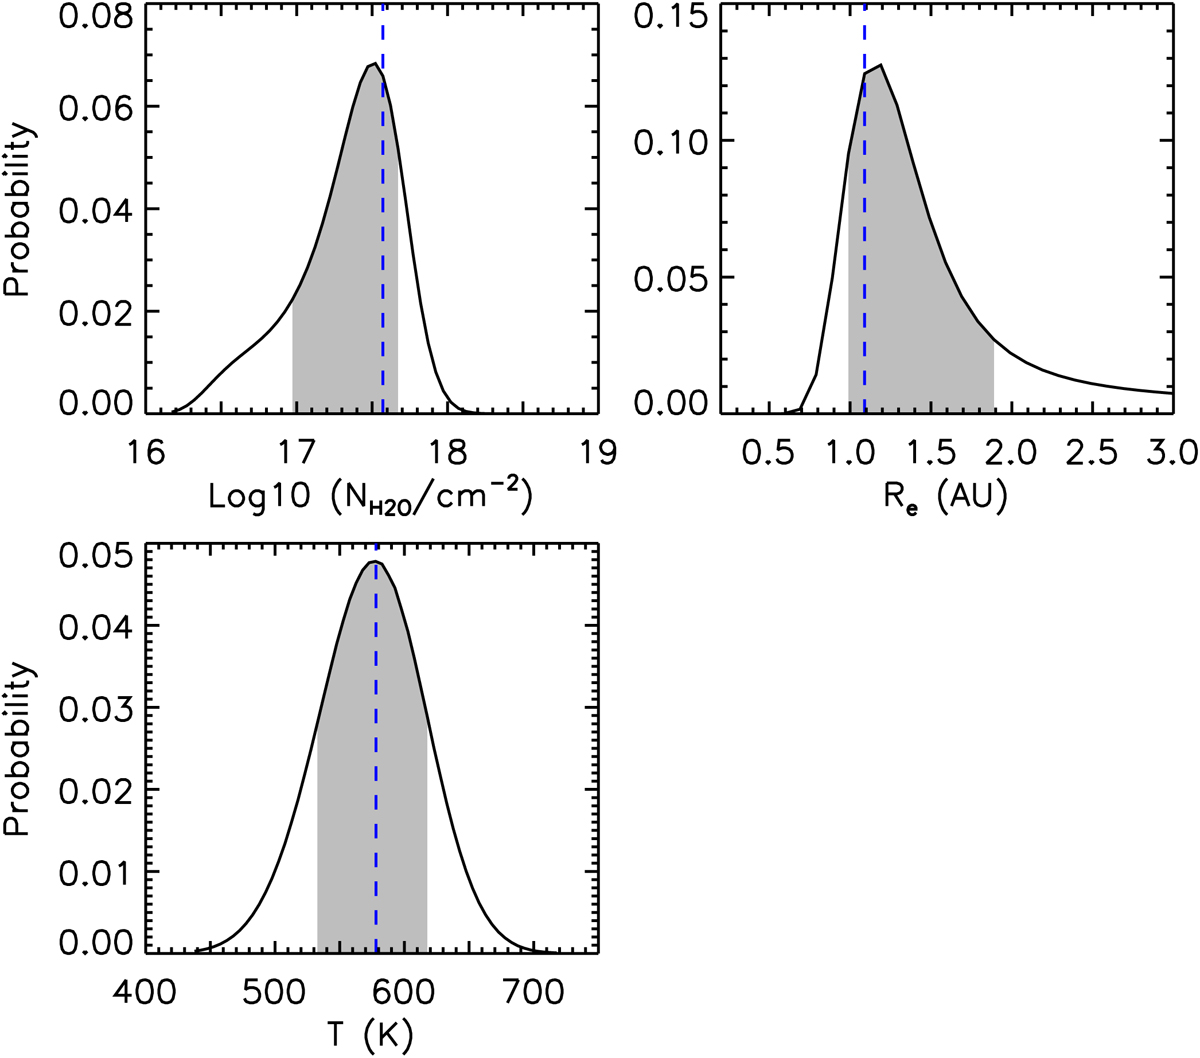
Bayesian probability distributions of the H2O parameters for AA Tau. These distributions are used to evaluate the 68% confidence intervals (shaded regions) of the best-fit model presented in Fig. 2. The blue vertical dashed lines give the best-fit values.
Current usage metrics show cumulative count of Article Views (full-text article views including HTML views, PDF and ePub downloads, according to the available data) and Abstracts Views on Vision4Press platform.
Data correspond to usage on the plateform after 2015. The current usage metrics is available 48-96 hours after online publication and is updated daily on week days.
Initial download of the metrics may take a while.