Fig. 2.
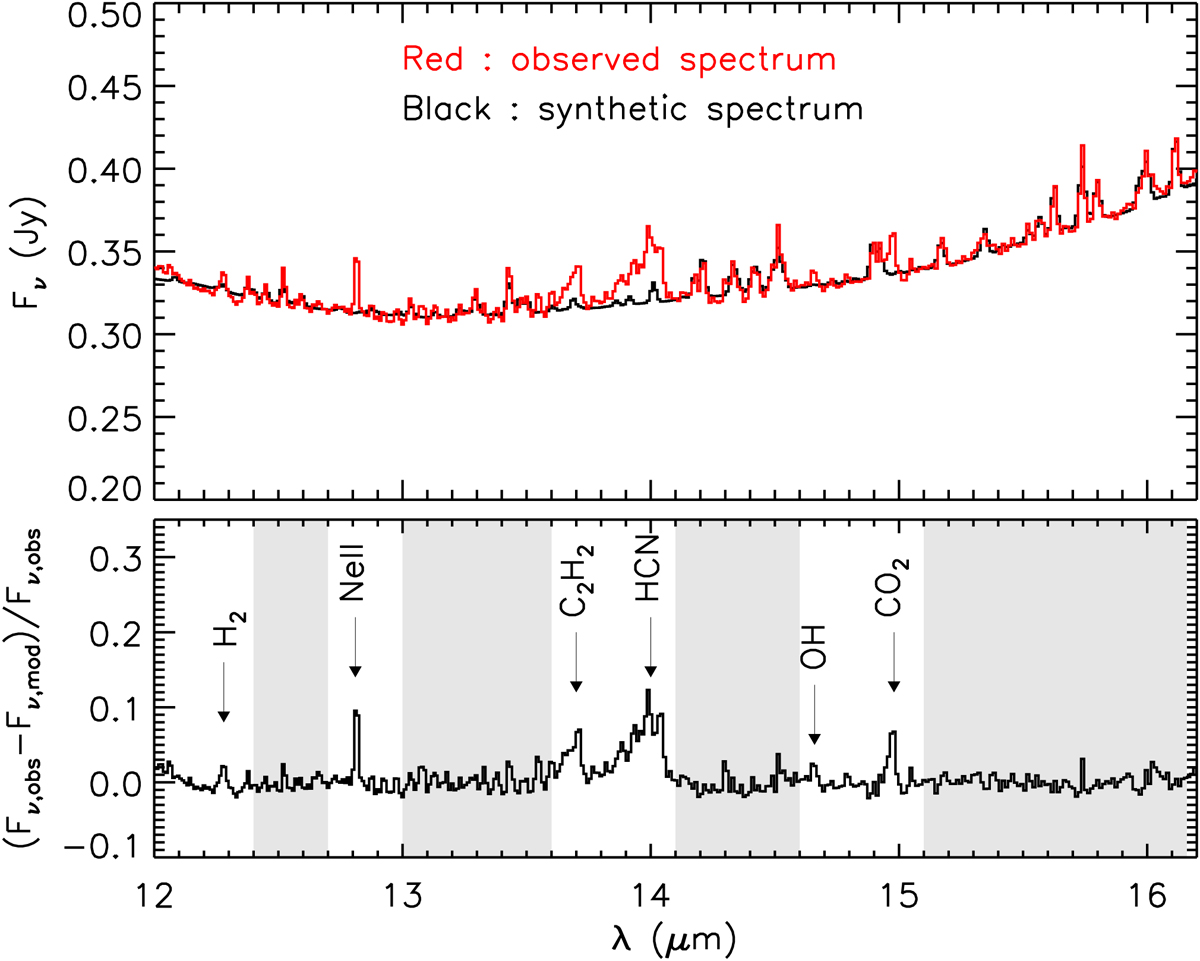
Comparison between the observed (red) and best-fit synthetic (black) spectra in the wavelength range 12 − 16 μm. The relative difference between model and observation (Fν, obs − Fν, mod)/Fν, obs is shown in the bottom panel. The gray shaded regions indicate the data points that contribute to the χ2 calculation in fitting the water spectrum. Prominent emission lines from other molecules are shown.
Current usage metrics show cumulative count of Article Views (full-text article views including HTML views, PDF and ePub downloads, according to the available data) and Abstracts Views on Vision4Press platform.
Data correspond to usage on the plateform after 2015. The current usage metrics is available 48-96 hours after online publication and is updated daily on week days.
Initial download of the metrics may take a while.