Free Access
Fig. A.1.
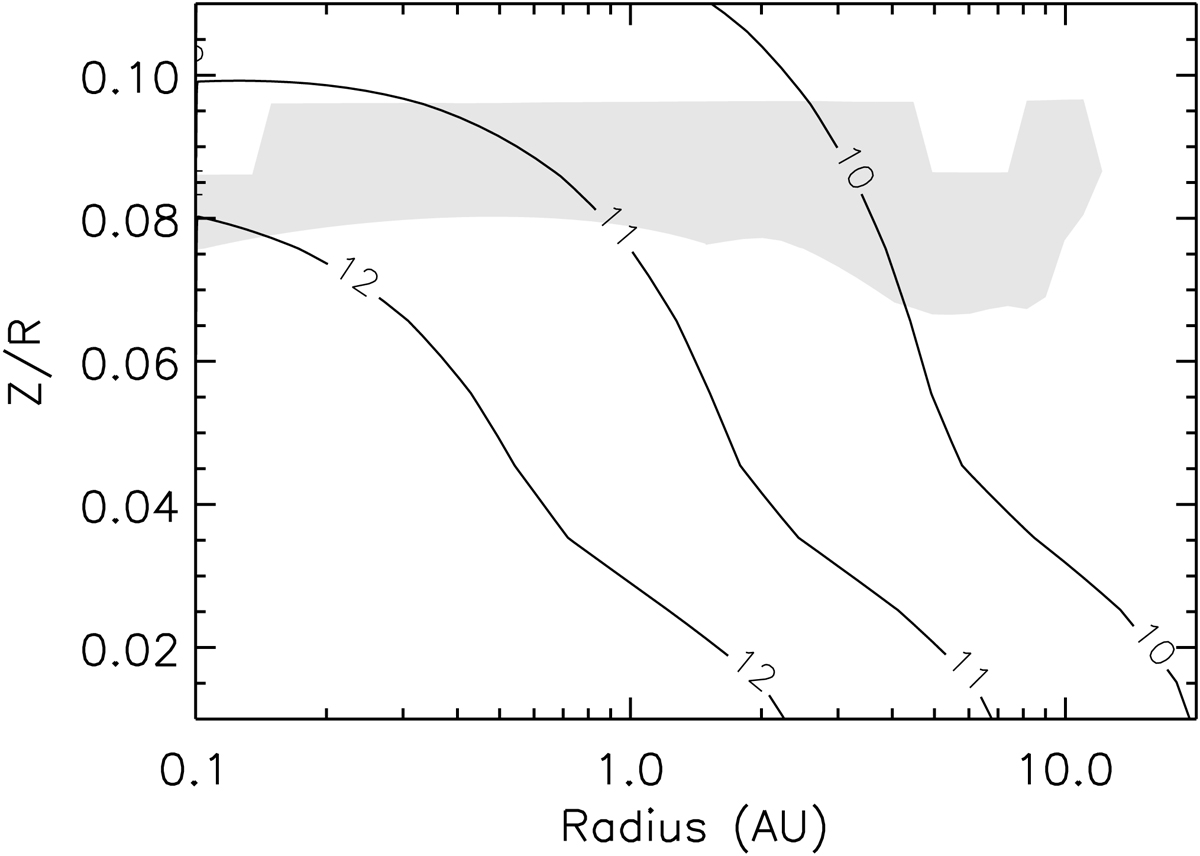
Gas density Log (ngas/cm−3) of the reference model at 10, 11, and 12, respectively. The shaded area is identical to that in Fig. 9. In the water emitting region, the gas density is close to or larger than the critical density, which implies that our LTE approximation is valid.
Current usage metrics show cumulative count of Article Views (full-text article views including HTML views, PDF and ePub downloads, according to the available data) and Abstracts Views on Vision4Press platform.
Data correspond to usage on the plateform after 2015. The current usage metrics is available 48-96 hours after online publication and is updated daily on week days.
Initial download of the metrics may take a while.