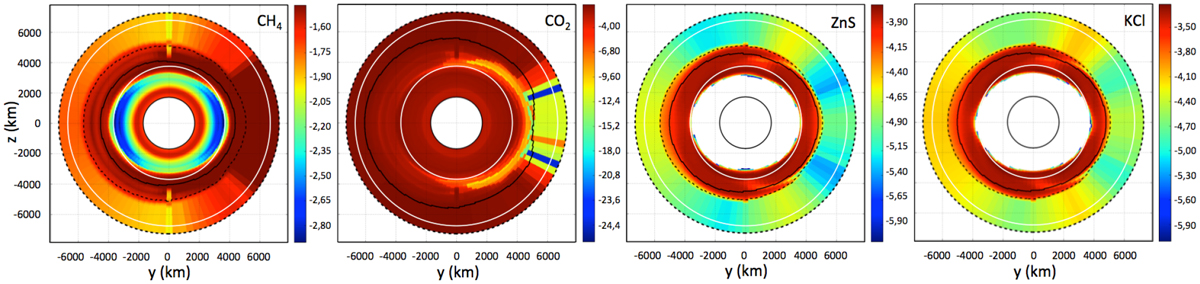
Fig. 8
Distribution of the logarithm of the mass mixing ratio of some absorbing species at the terminator in a simulation of the atmosphere of GJ 1214 b by Charnay et al. (2015). For KCl and ZnS, only the molecules in the condensed phase are considered. The dashed (solid) black curves are the contour of unit optical depth with (without) cloud opacities at a wavelength relevant to the molecule considered (1.17 μm for CH4; 4.30 μm for CO2; 1.08 μm for KCl et ZnS). The size of the inner white disc delimiting the base of the atmosphere is reduced for clarity. The whole simulated atmosphere is shown. The two white circles delimit the region enlarged in Fig. 10.
Current usage metrics show cumulative count of Article Views (full-text article views including HTML views, PDF and ePub downloads, according to the available data) and Abstracts Views on Vision4Press platform.
Data correspond to usage on the plateform after 2015. The current usage metrics is available 48-96 hours after online publication and is updated daily on week days.
Initial download of the metrics may take a while.