Fig. 7
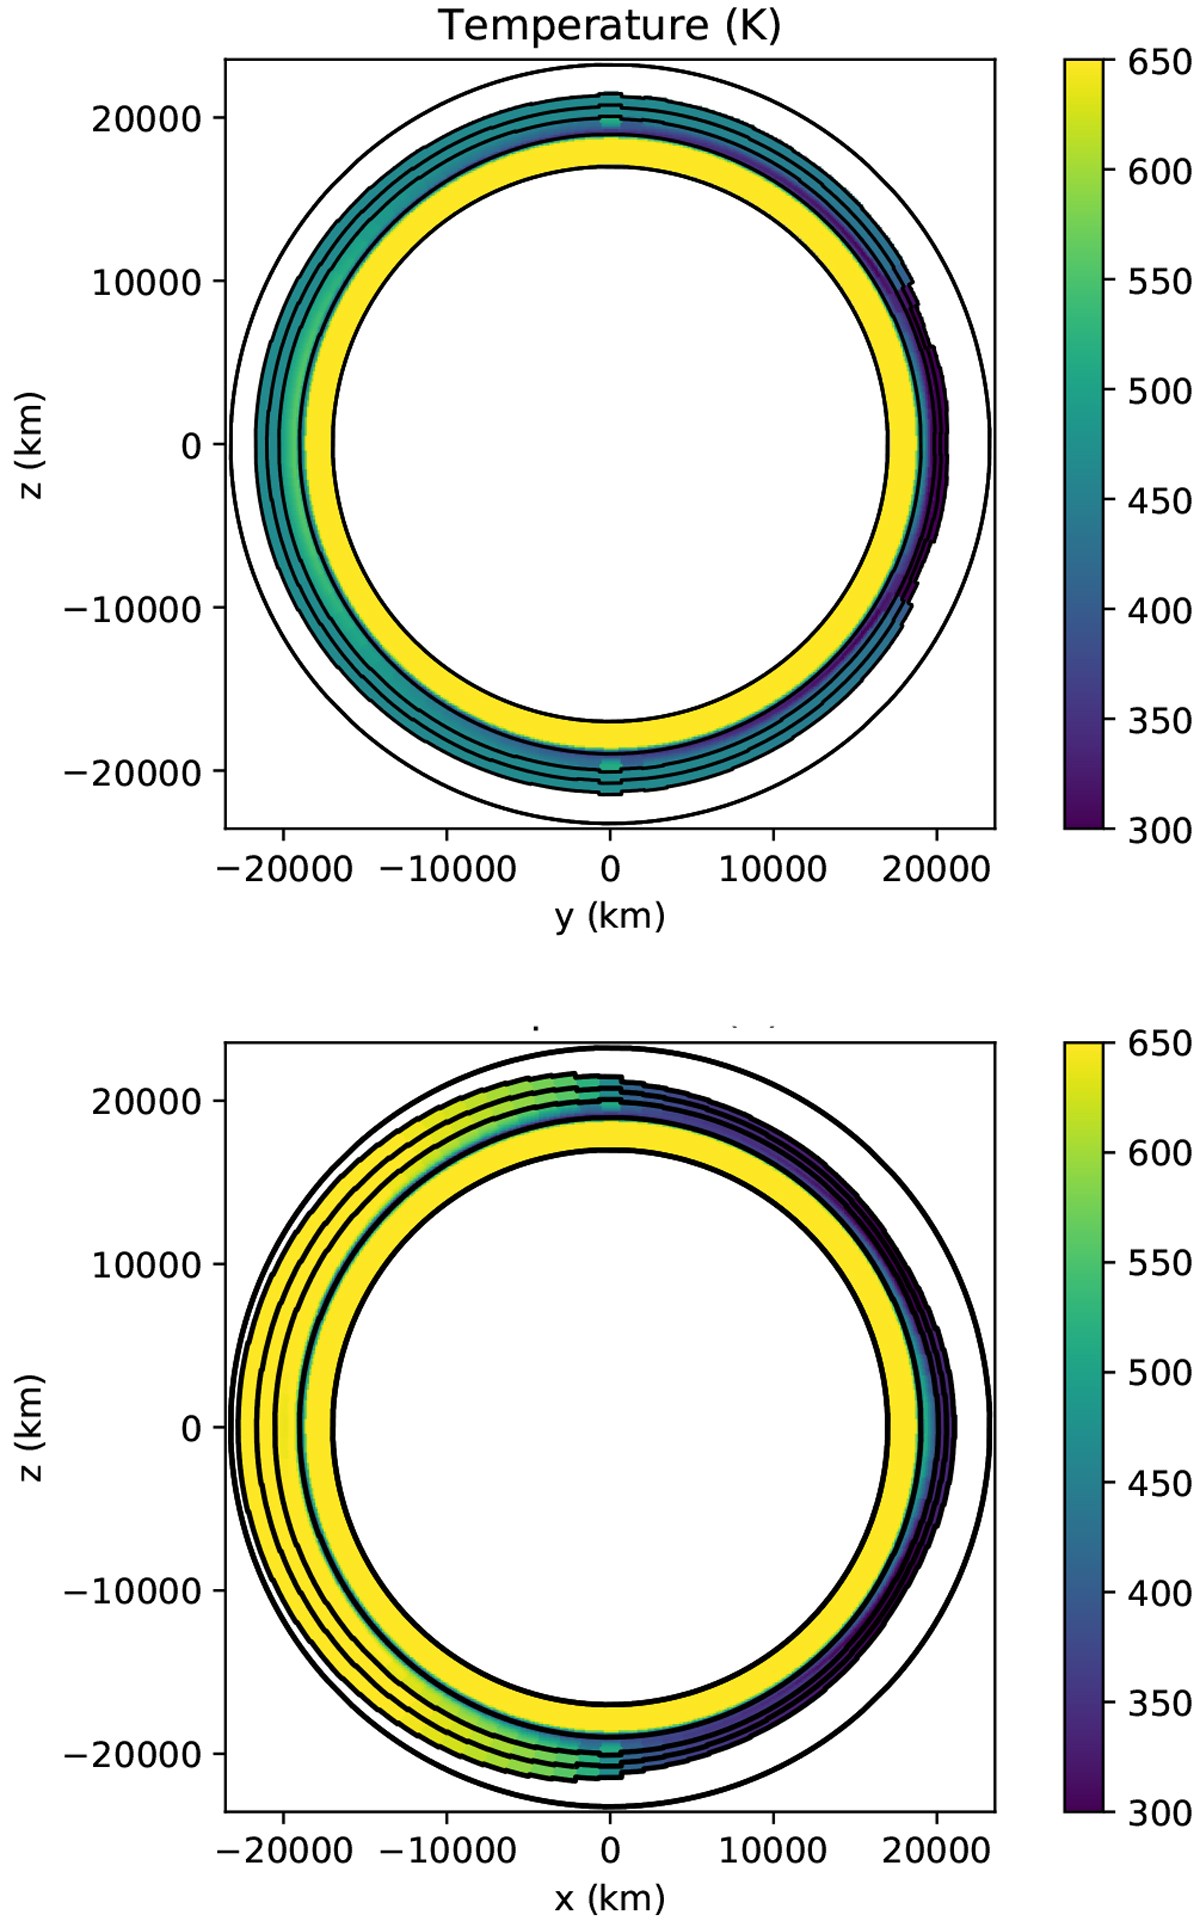
Colour maps showing the temperature distribution in the model atmosphere of the 100× solar metallicity simulation from Charnay et al. (2015). The inner white disc represents the inner part of the planet with a radius assumed to be equal to that of GJ 1214 b (17.600 km). Top panel: temperature at the terminator. The planet is seen from the observer during transit, the poles being at the top and bottom. Bottom panel: the star is on the left and the observer on the right on the z = 0 axis. The poles are on the x = 0 axis. From centre outward, the five solid lines are respectively the 106, 103, 1, 10−2, and 10−4 Pa pressure levels. The outer circle is there as an eye guide to highlight the non-sphericity of the planet. Temperature is well homogenised below the ~103 Pa level. Maps are to scale and show that the dayside is noticeably more vertically extended than the nightside.
Current usage metrics show cumulative count of Article Views (full-text article views including HTML views, PDF and ePub downloads, according to the available data) and Abstracts Views on Vision4Press platform.
Data correspond to usage on the plateform after 2015. The current usage metrics is available 48-96 hours after online publication and is updated daily on week days.
Initial download of the metrics may take a while.