Fig. 6
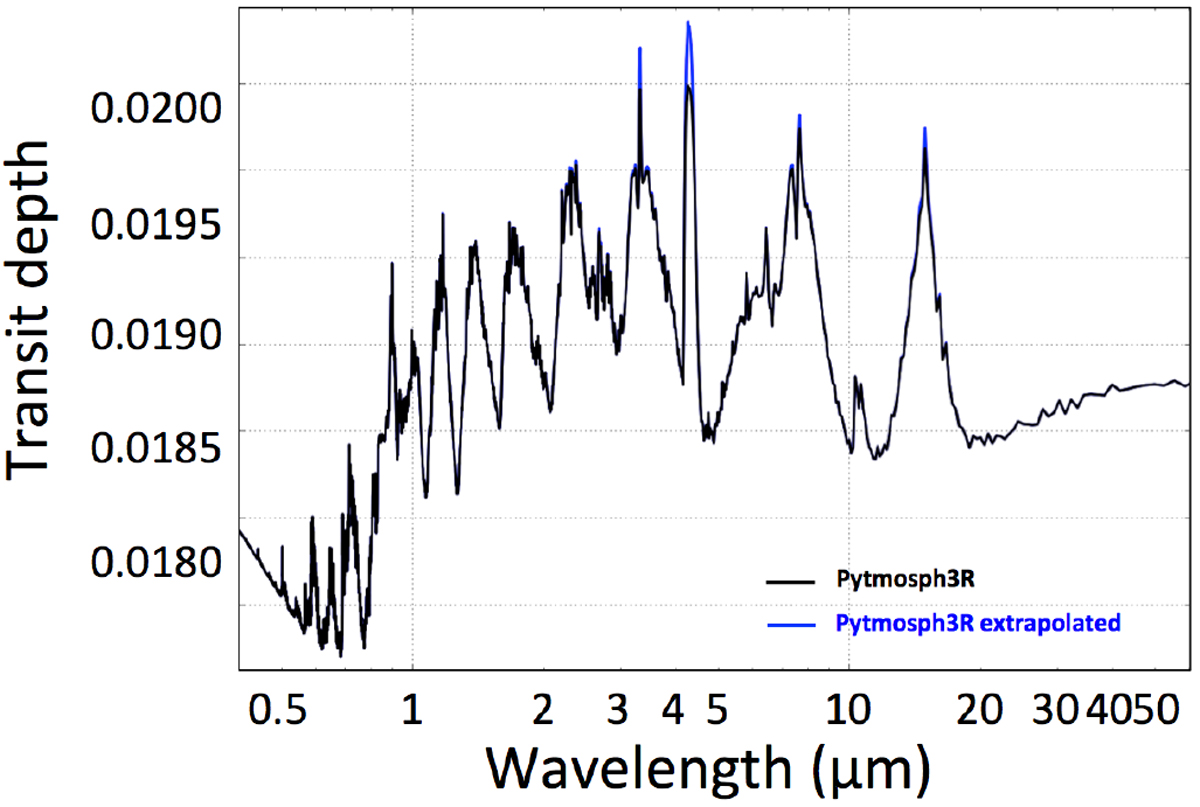
Transit spectrum generated by Pytmosph3R from the outputs of a GCM simulation of GJ 1214 b (Charnay et al. 2015). The black curve represents the effective radius obtained when accounting only for the part of the atmosphere explicitly modelled by the GCM (down to ~ 0.5 Pa). The blue curve shows the result when the model is extended by an isothermal atmosphere down to 10−4 Pa. Further lowering the pressure of the model top does not alter the spectrum.
Current usage metrics show cumulative count of Article Views (full-text article views including HTML views, PDF and ePub downloads, according to the available data) and Abstracts Views on Vision4Press platform.
Data correspond to usage on the plateform after 2015. The current usage metrics is available 48-96 hours after online publication and is updated daily on week days.
Initial download of the metrics may take a while.