Fig. 7
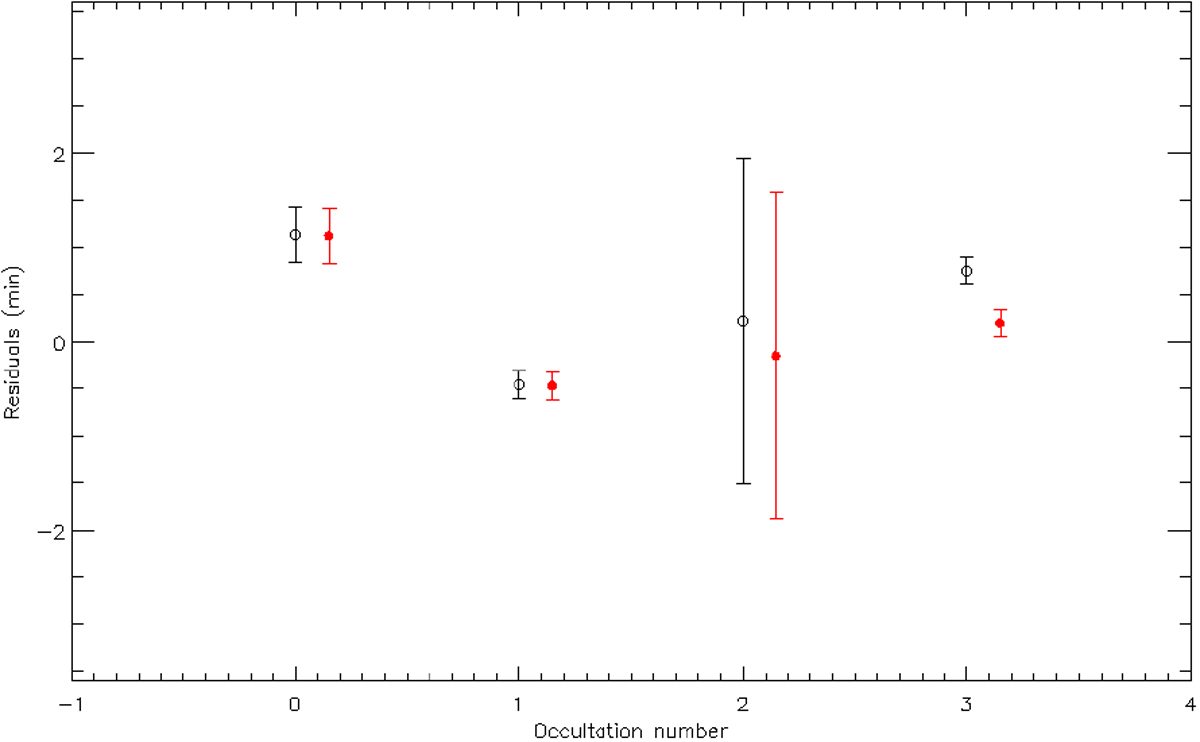
Residuals of the model fit on the occultation observations. Notice that the occultation observations were taken from the compilation of Maxted et al. (2013), too. x-axis: the index of the occultation observations used for the fit, in order of increasing time (not the cycle number!). y-axis: the residual of the fit in minutes. The meaning of symbols is the same as in Fig. 6. Table A.1 helps to identify the observational point via its index. A small improvement can be seen in the last occultation measurement with the complicated apsidal motion model relative to the simple model.
Current usage metrics show cumulative count of Article Views (full-text article views including HTML views, PDF and ePub downloads, according to the available data) and Abstracts Views on Vision4Press platform.
Data correspond to usage on the plateform after 2015. The current usage metrics is available 48-96 hours after online publication and is updated daily on week days.
Initial download of the metrics may take a while.