Fig. 6
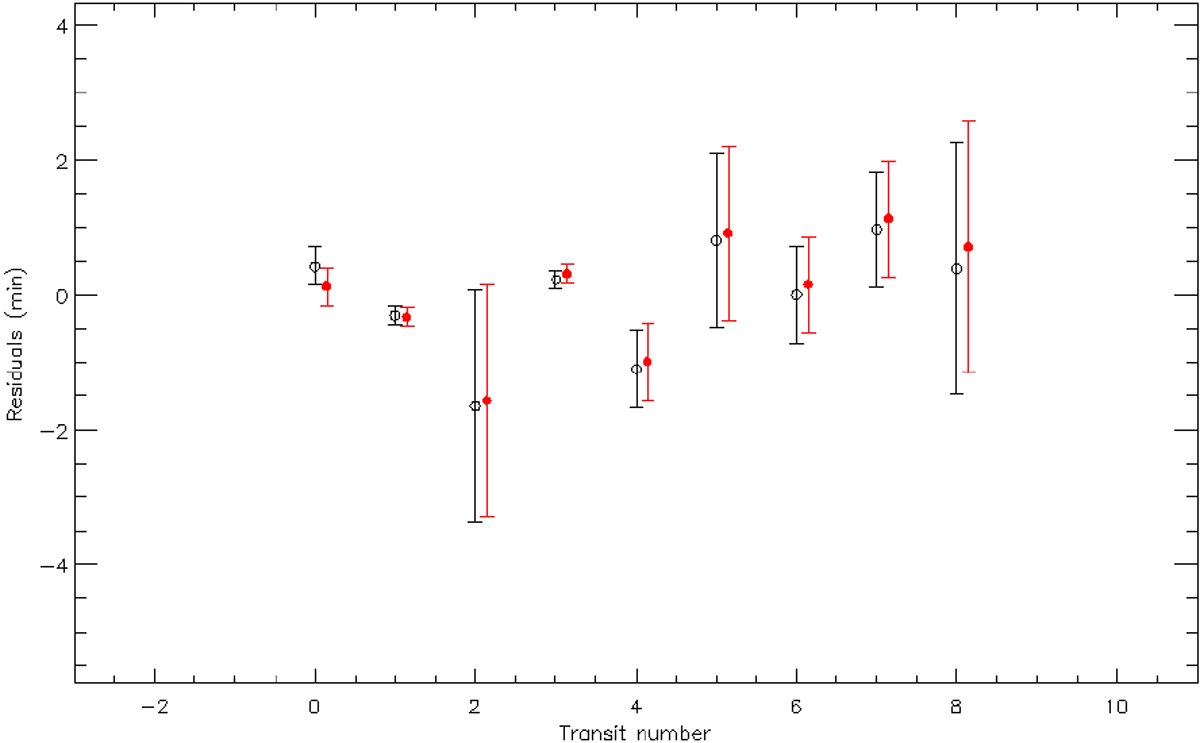
Residuals of the model fit on the transit observations. We note that the transit observations were taken from the compilation of Maxted et al. (2013). x-axis: the index of the transit observations used for the fit, in order of increasing time (not the cycle number!). y-axis: the residual of the fit in minutes. The open black points represent the residuals of the fit without any apsidal motion because we forced ![]() (including all relativistic and classical tidal terms), as well as Vtide = 0.0 m s−1. The red filled circles represent the residuals of the model with apsidal motion (see Eq. (19)). For sake of clarity, the red symbols were shifted horizontally by 0.15 units. Table A.1 helps to identify the observational point via its index. No improvement can be seen in the transit data with the more complicated apsidal motion model which is contrary to the case of RVs (see Fig. 5.) where we could see significant improvement. This is in accordance with the expectation of Sect. 3.
(including all relativistic and classical tidal terms), as well as Vtide = 0.0 m s−1. The red filled circles represent the residuals of the model with apsidal motion (see Eq. (19)). For sake of clarity, the red symbols were shifted horizontally by 0.15 units. Table A.1 helps to identify the observational point via its index. No improvement can be seen in the transit data with the more complicated apsidal motion model which is contrary to the case of RVs (see Fig. 5.) where we could see significant improvement. This is in accordance with the expectation of Sect. 3.
Current usage metrics show cumulative count of Article Views (full-text article views including HTML views, PDF and ePub downloads, according to the available data) and Abstracts Views on Vision4Press platform.
Data correspond to usage on the plateform after 2015. The current usage metrics is available 48-96 hours after online publication and is updated daily on week days.
Initial download of the metrics may take a while.