Fig. 5
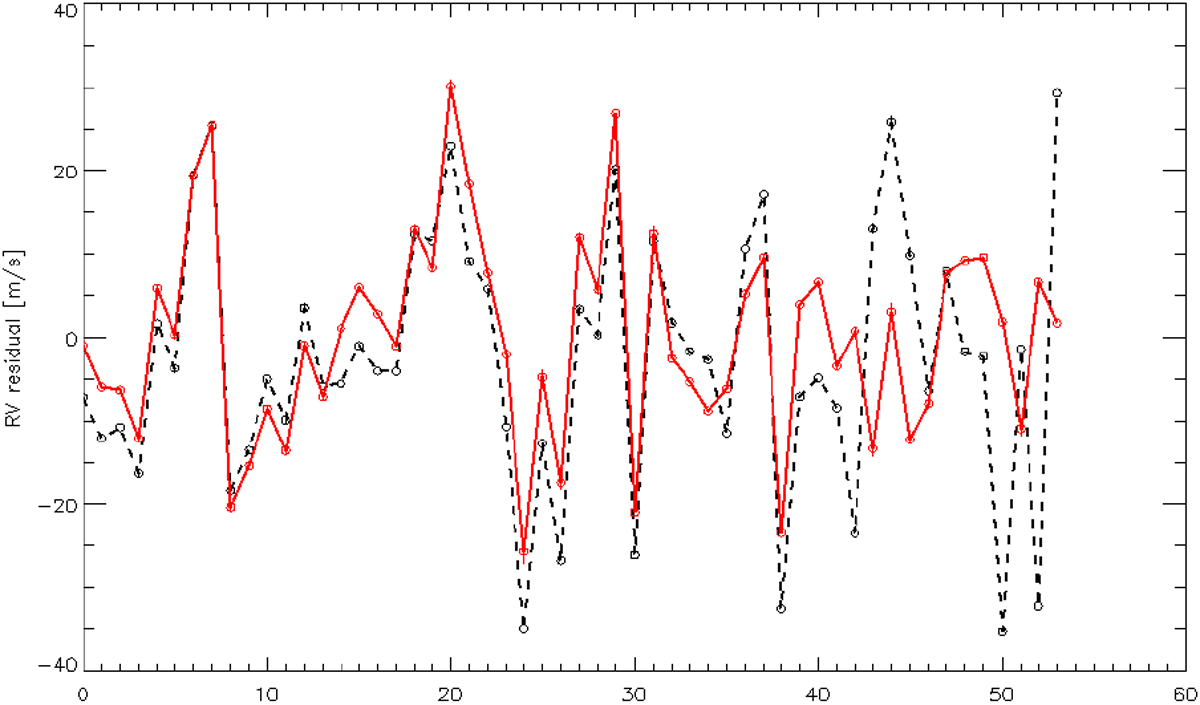
RV-residuals of the model fit. x-axis: the index of the RV points used for the fit, in order of increasing time. y-axis: the residual of the fit in m s−1. The dashed black curve represents the residuals of the fit without any apsidal motion because we forced ![]() (including all relativistic and classical tidal terms), as well as Vtide = 0.0 m s−1. The solid red curve represents the residuals of the model with apsidal motion (see Eq. (19)). A significant improvement in the residuals can be seen. Table A.1 helps to identify the observational point via its index.
(including all relativistic and classical tidal terms), as well as Vtide = 0.0 m s−1. The solid red curve represents the residuals of the model with apsidal motion (see Eq. (19)). A significant improvement in the residuals can be seen. Table A.1 helps to identify the observational point via its index.
Current usage metrics show cumulative count of Article Views (full-text article views including HTML views, PDF and ePub downloads, according to the available data) and Abstracts Views on Vision4Press platform.
Data correspond to usage on the plateform after 2015. The current usage metrics is available 48-96 hours after online publication and is updated daily on week days.
Initial download of the metrics may take a while.