Fig. 4
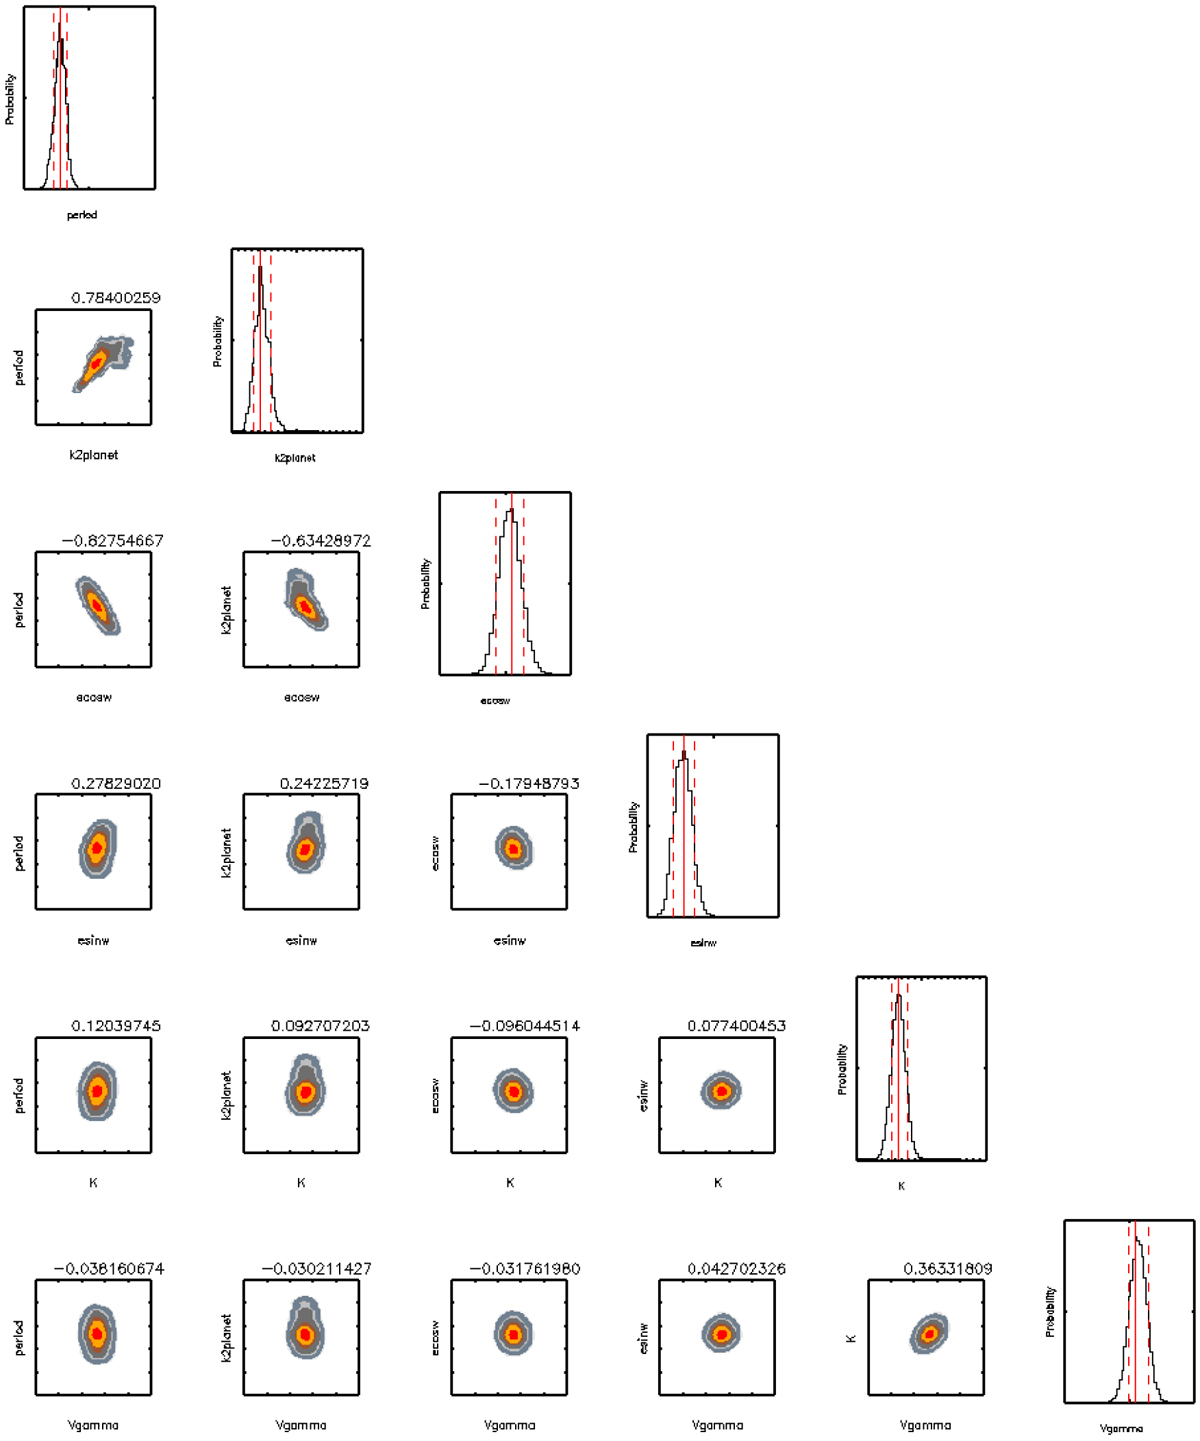
Correlation plots and probability histograms for WASP-18AB RV+TTV fit. Red and orange areas denote the 1σ region, different gray areas denote the 2σ and 3σ regions. Numbers over the panels are the values of the Pearson-correlation coefficients between the parameters. The solid and dashed lines show the most probable solutions and the 1σ limits in thehistograms. Only a subset of the parameters are shown.
Current usage metrics show cumulative count of Article Views (full-text article views including HTML views, PDF and ePub downloads, according to the available data) and Abstracts Views on Vision4Press platform.
Data correspond to usage on the plateform after 2015. The current usage metrics is available 48-96 hours after online publication and is updated daily on week days.
Initial download of the metrics may take a while.