Fig. 7.
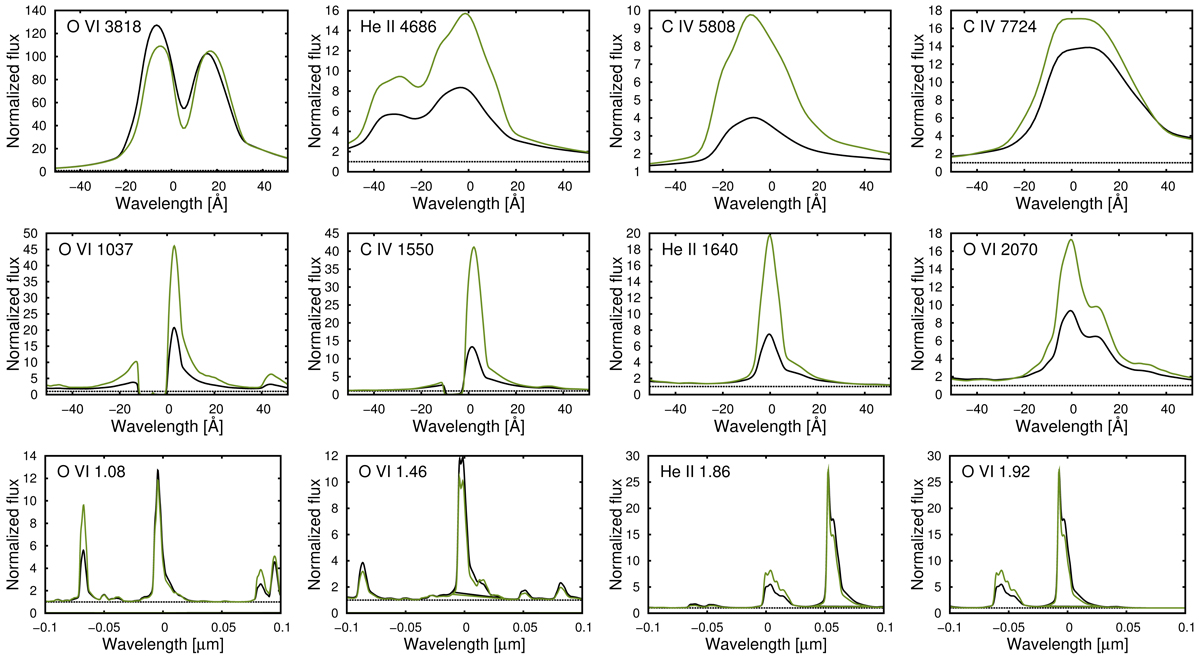
Influence of clumping on the line strength. Emission lines in the optical (upper panels), the UV (middle panels), and the IR (lower panels) regions of the model with Mini = 131 M⊙ in the CHeB evolutionary phase (mass-loss rate of log(Ṁ/M⊙/yr = −4.23)). X-axis is centered around the wavelength indicated by the key legend (e.g., He II 4686 means He II λ4686 Å). Green lines corresponds to clumped wind models with D = 10, and black lines to smooth wind models with D = 1.
Current usage metrics show cumulative count of Article Views (full-text article views including HTML views, PDF and ePub downloads, according to the available data) and Abstracts Views on Vision4Press platform.
Data correspond to usage on the plateform after 2015. The current usage metrics is available 48-96 hours after online publication and is updated daily on week days.
Initial download of the metrics may take a while.