Fig. 6.
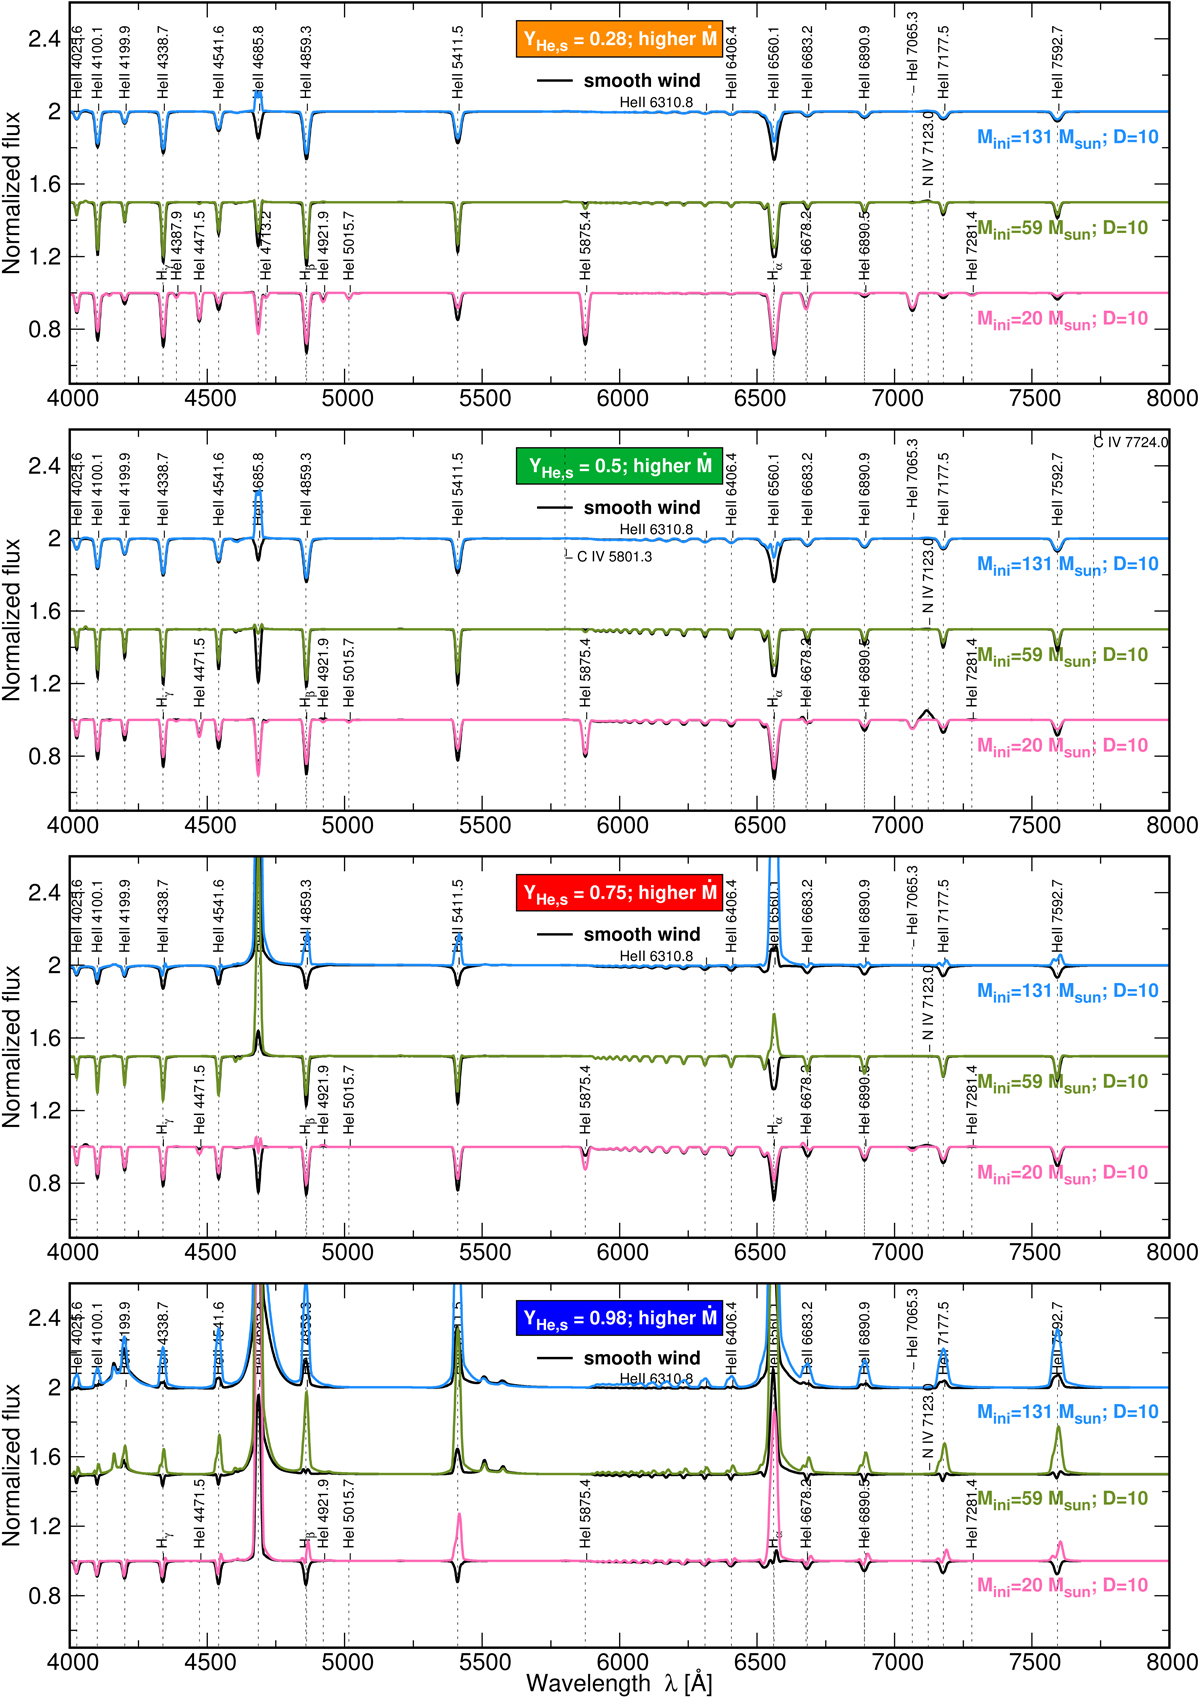
PoWR spectra in the optical region of TWUIN stars with different Mini (see labels on the right side of the panels) and in different CHB evolutionary phases marked by the value YS in the colored boxes. The mass-loss rates are taken from the stellar evolutionary calculations (i.e., higher Ṁ). Colored lines correspond to the clumped wind models (i.e., D = 10), while the black lines correspond to the smooth wind.
Current usage metrics show cumulative count of Article Views (full-text article views including HTML views, PDF and ePub downloads, according to the available data) and Abstracts Views on Vision4Press platform.
Data correspond to usage on the plateform after 2015. The current usage metrics is available 48-96 hours after online publication and is updated daily on week days.
Initial download of the metrics may take a while.