Free Access
Fig. 4.
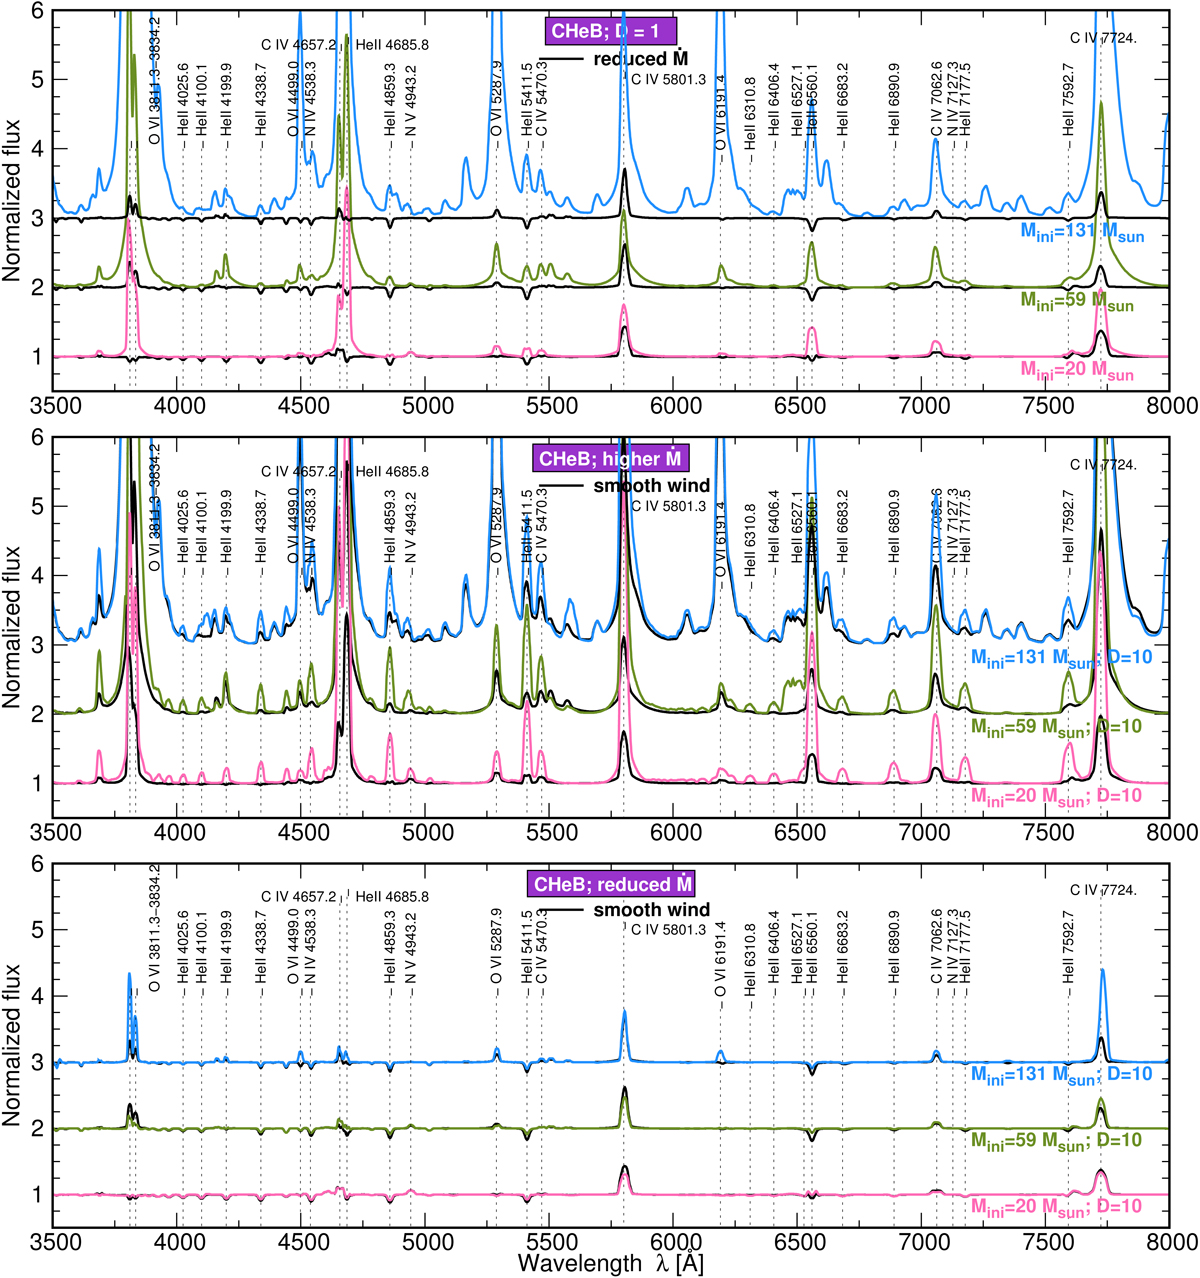
Top panel: same as Fig. 3, but for the CHeB evolutionary phase with YS as given in Table 1. Middle and lowest panels: same as the top panel, but for clumped wind (i.e., D = 10) with nominal (i.e., higher) Ṁ (middle panel) and reduced Ṁ (lowest panel); black lines correspond to the model with smooth wind assumption.
Current usage metrics show cumulative count of Article Views (full-text article views including HTML views, PDF and ePub downloads, according to the available data) and Abstracts Views on Vision4Press platform.
Data correspond to usage on the plateform after 2015. The current usage metrics is available 48-96 hours after online publication and is updated daily on week days.
Initial download of the metrics may take a while.