Fig. 2.
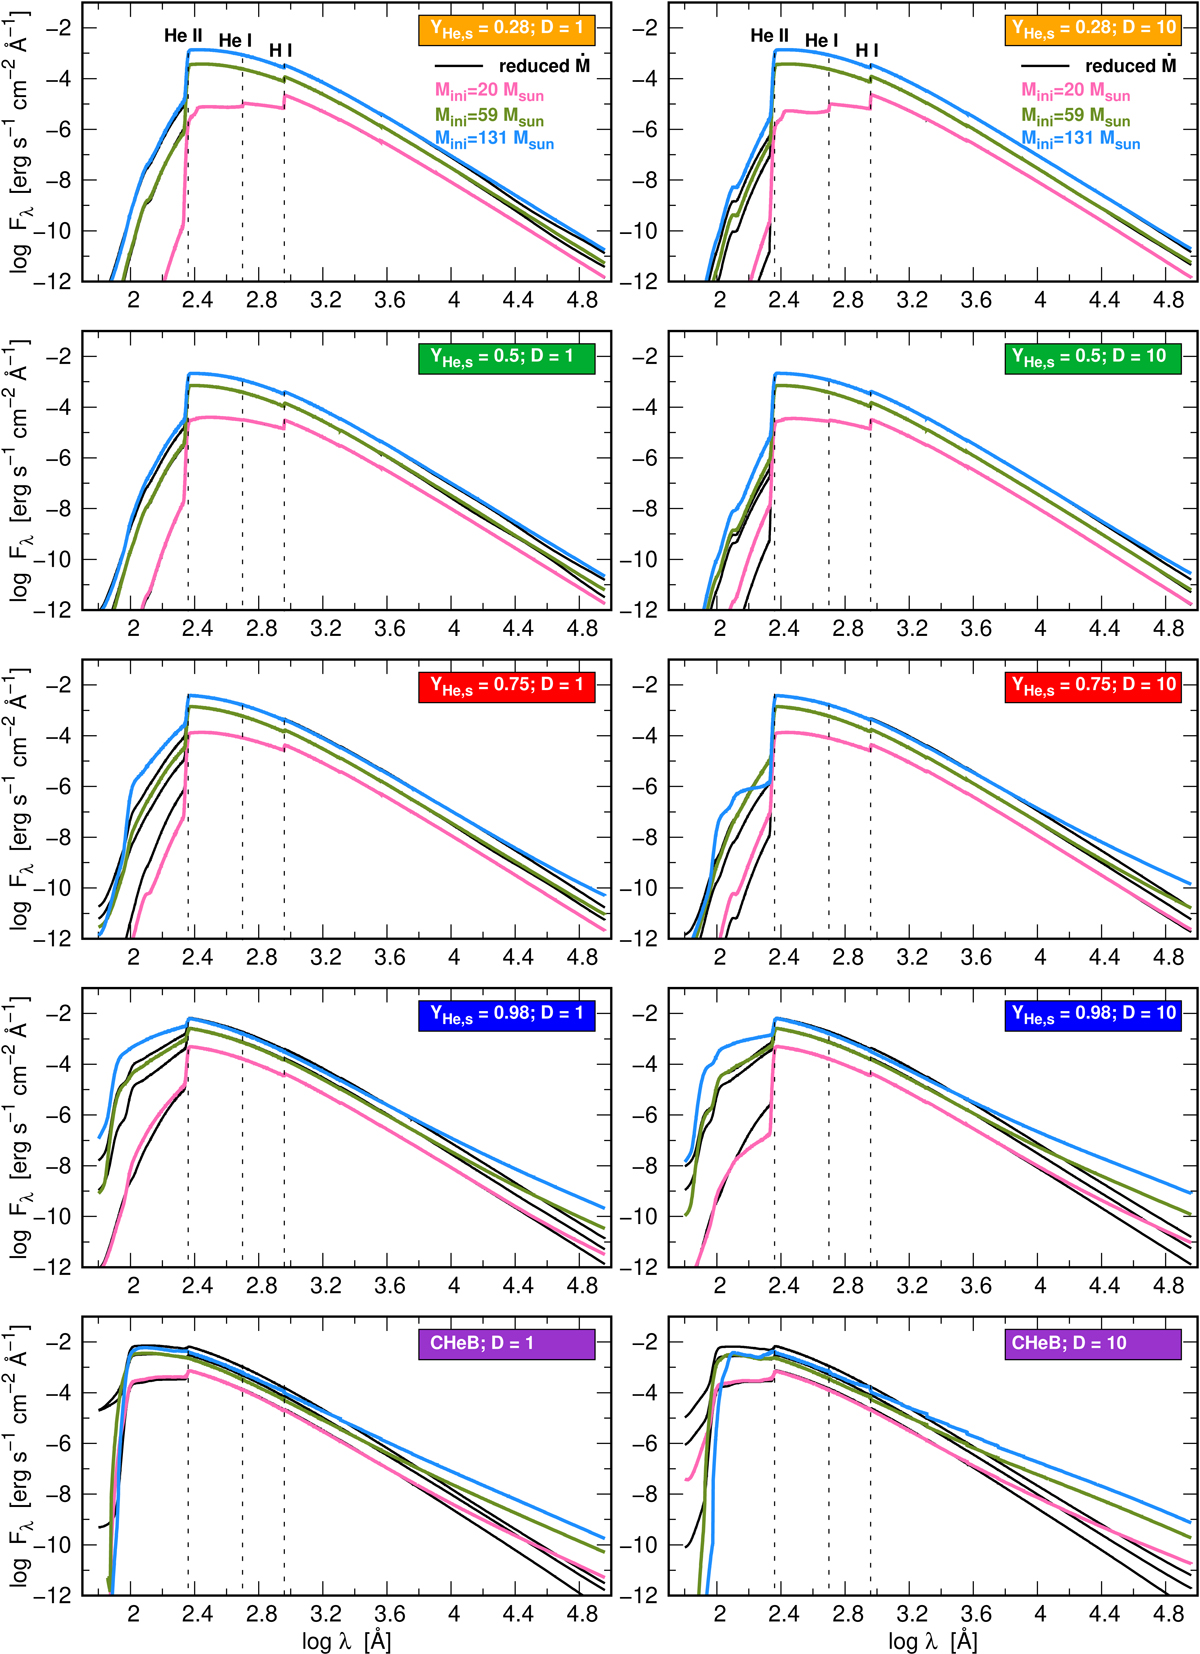
Spectral energy distribution (continuum) of chemically homogeneously evolving stars in different evolutionary stages as marked in the colored boxes in each panel. Left panels: provide the continuum SED of the models calculated with a smooth (D = 1) wind, while the right panels depict the same for the clumped (D = 10) wind assumption. The colored lines correspond to the models with specific Mini (denoted in the top panels) and calculated assuming the same (nominal) mass-loss rate as given in Table 1. For each colored line, a black line also represents the SED of the model for the same star in the same evolutionary stages with the same clumping factor D, but assuming a mass-loss rate 100 times lower. For better visibility of the differences between the SEDs in the CHeB phase, see Fig. B1.
Current usage metrics show cumulative count of Article Views (full-text article views including HTML views, PDF and ePub downloads, according to the available data) and Abstracts Views on Vision4Press platform.
Data correspond to usage on the plateform after 2015. The current usage metrics is available 48-96 hours after online publication and is updated daily on week days.
Initial download of the metrics may take a while.