Fig. 1.
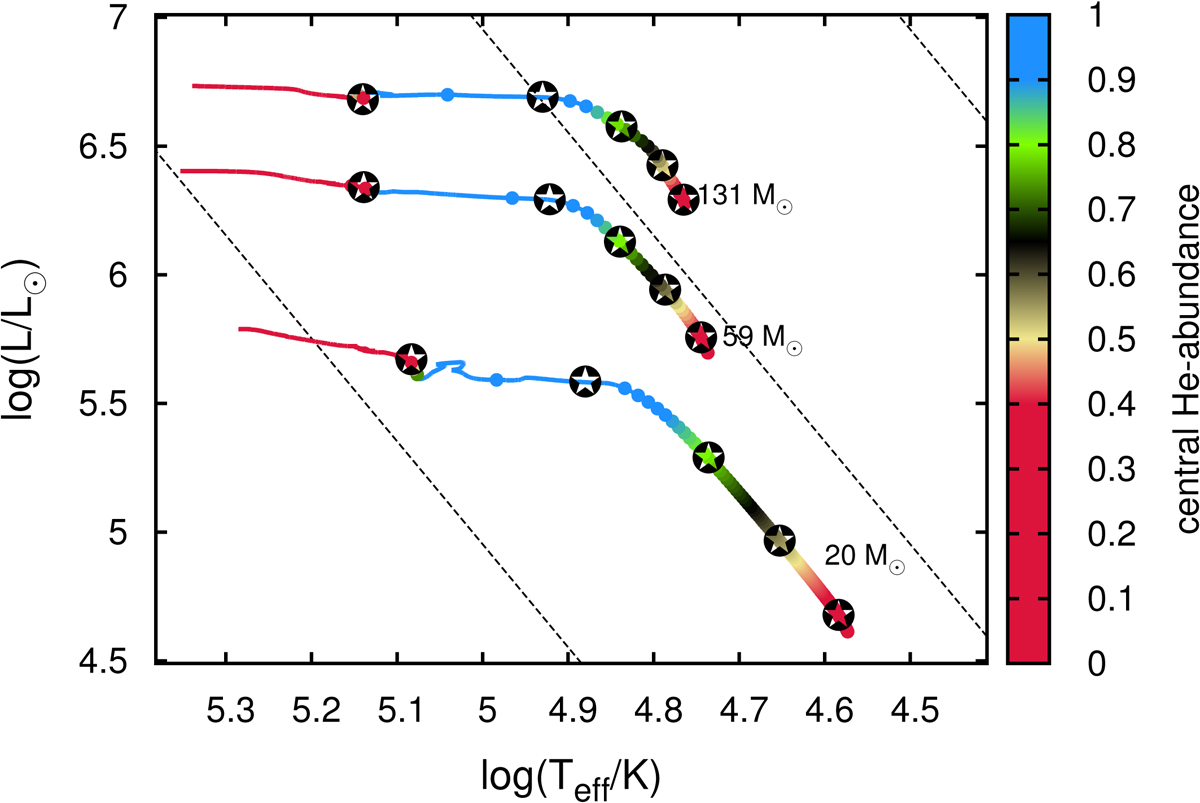
HR diagram of our models (black symbols) and their corresponding evolutionary sequences. The sequences are taken from Paper I and Szécsi (2016). Initial masses are labeled, showing where the tracks start their evolution, proceeding toward the hot side of the diagram. Colors show the central helium mass fraction, and dots represent every 105 years of evolution. Dashed lines mark equiradial lines with 1, 10, and 100 R⊙ from left to right. The black symbols represent the models for which we computed synthetic spectra. From right to left: black symbols correspond to evolutionary phases with surface helium mass fractions of 0.28, 0.5, 0.75, and 0.98, and the fifth symbol on the very left corresponds to a central helium mass fraction of 0.5, i.e., the middle of the CHeB phase.
Current usage metrics show cumulative count of Article Views (full-text article views including HTML views, PDF and ePub downloads, according to the available data) and Abstracts Views on Vision4Press platform.
Data correspond to usage on the plateform after 2015. The current usage metrics is available 48-96 hours after online publication and is updated daily on week days.
Initial download of the metrics may take a while.