Fig. 3.
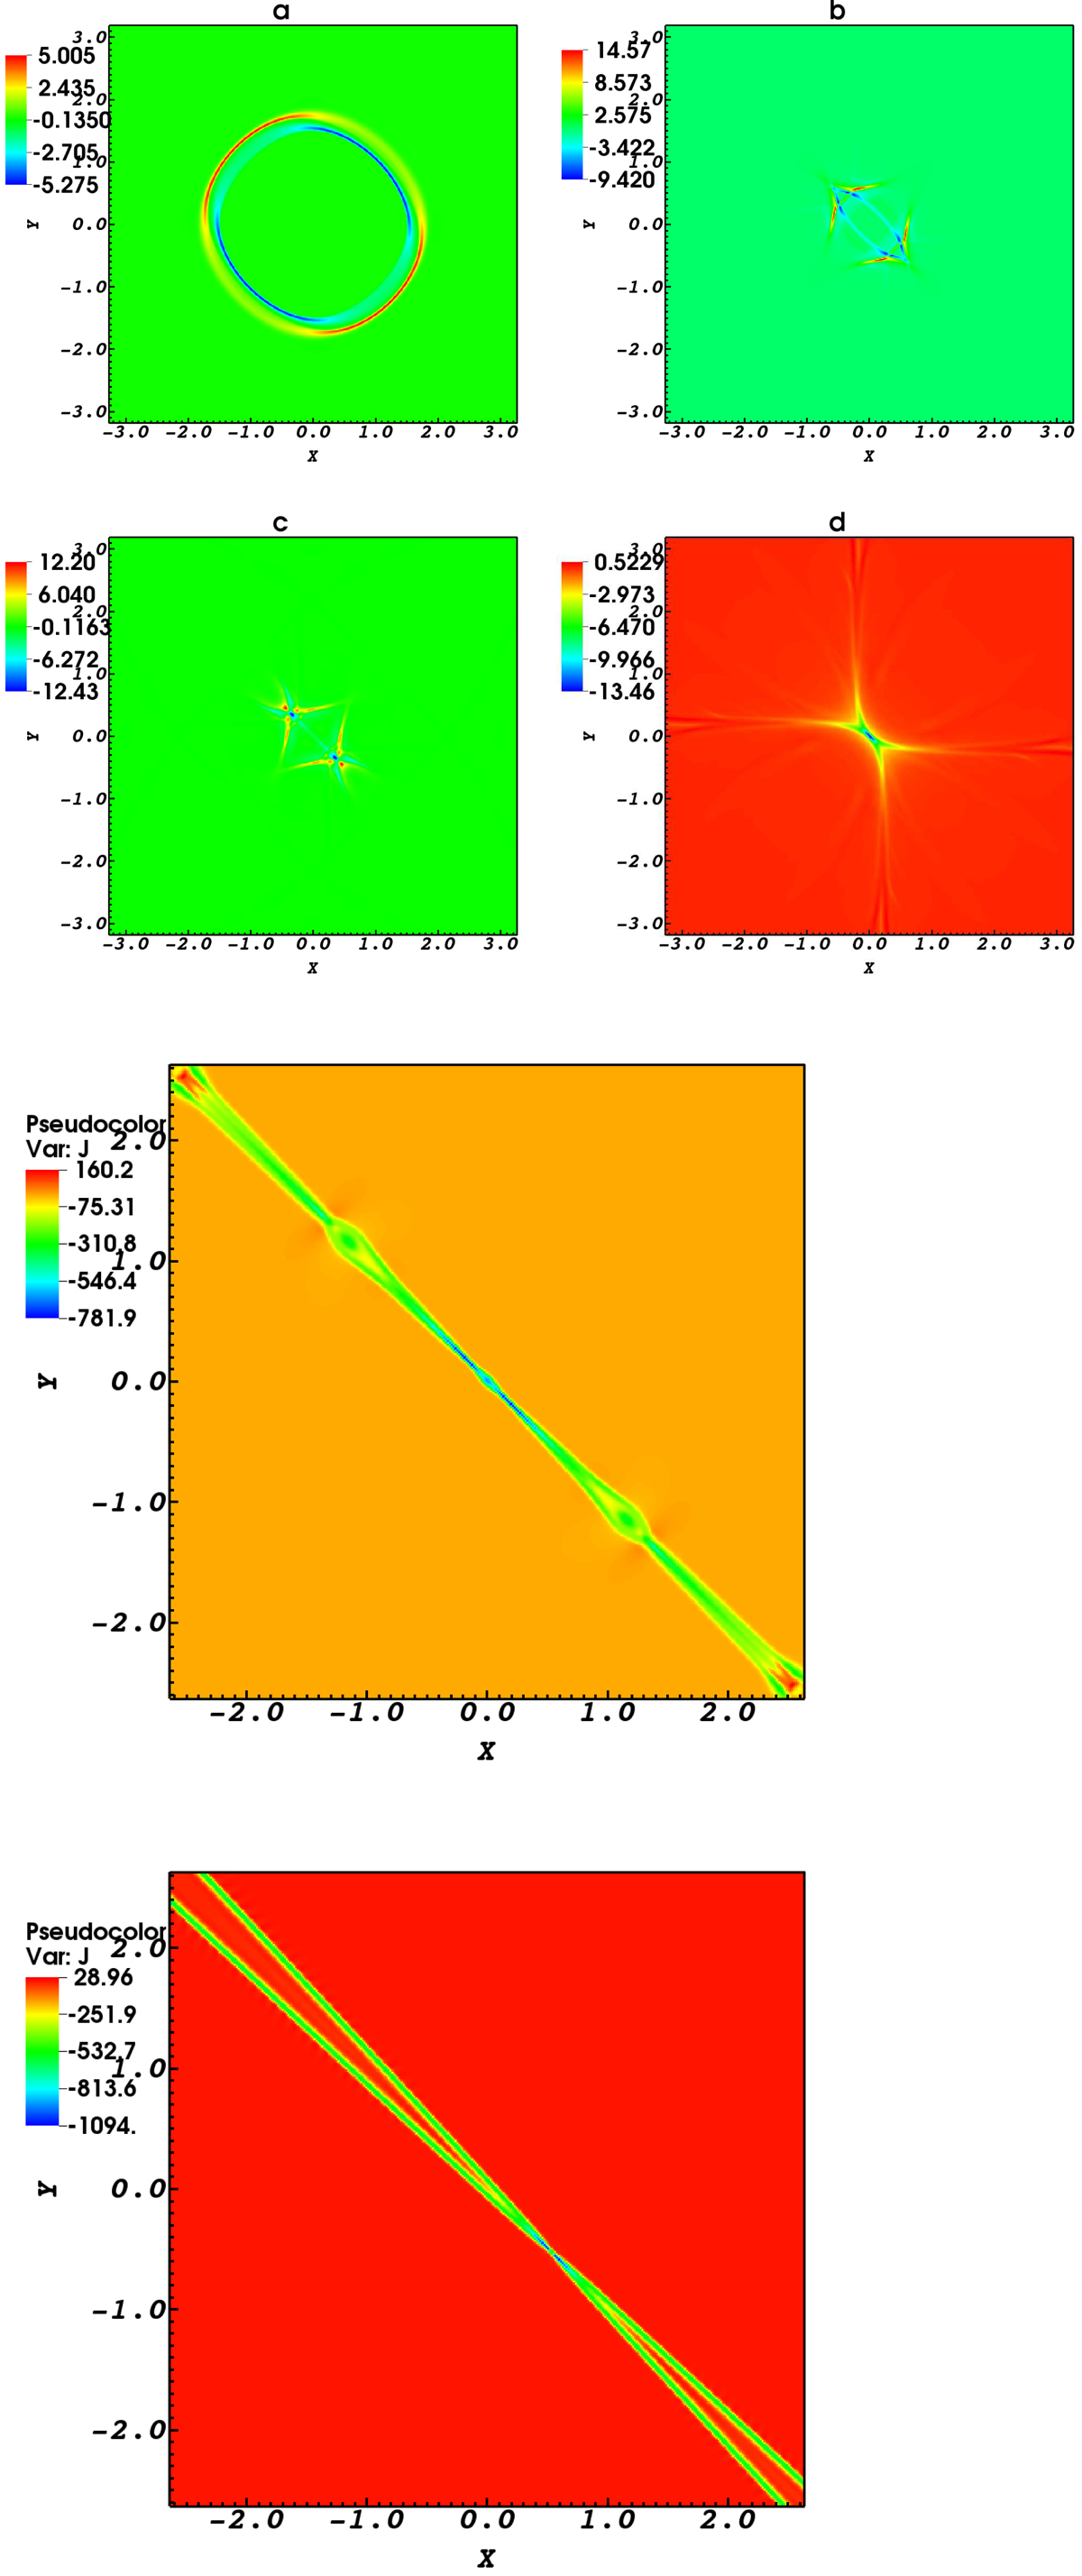
Spatial variation of the current density. The contours a till b show the gradual current density variation for −3.3 ≤ x ≤ 3.3, −3.2 ≤ x ≤ 3.2 (a at t = 0.6 s, b at t = 1.14 s, c at t = 1.3 s, and d at t = 3.52 s). The significant variation in current density is shown in the last two plots for −2.7 ≤ x ≤ 2.7, −2.6 ≤ x ≤ 2.6 respectively at t = 6.02 s and t = 7.6 s. This shows that the place of current sheet generation is coincident with the heating place because of the ohmic dissipation.
Current usage metrics show cumulative count of Article Views (full-text article views including HTML views, PDF and ePub downloads, according to the available data) and Abstracts Views on Vision4Press platform.
Data correspond to usage on the plateform after 2015. The current usage metrics is available 48-96 hours after online publication and is updated daily on week days.
Initial download of the metrics may take a while.