Fig. 2.
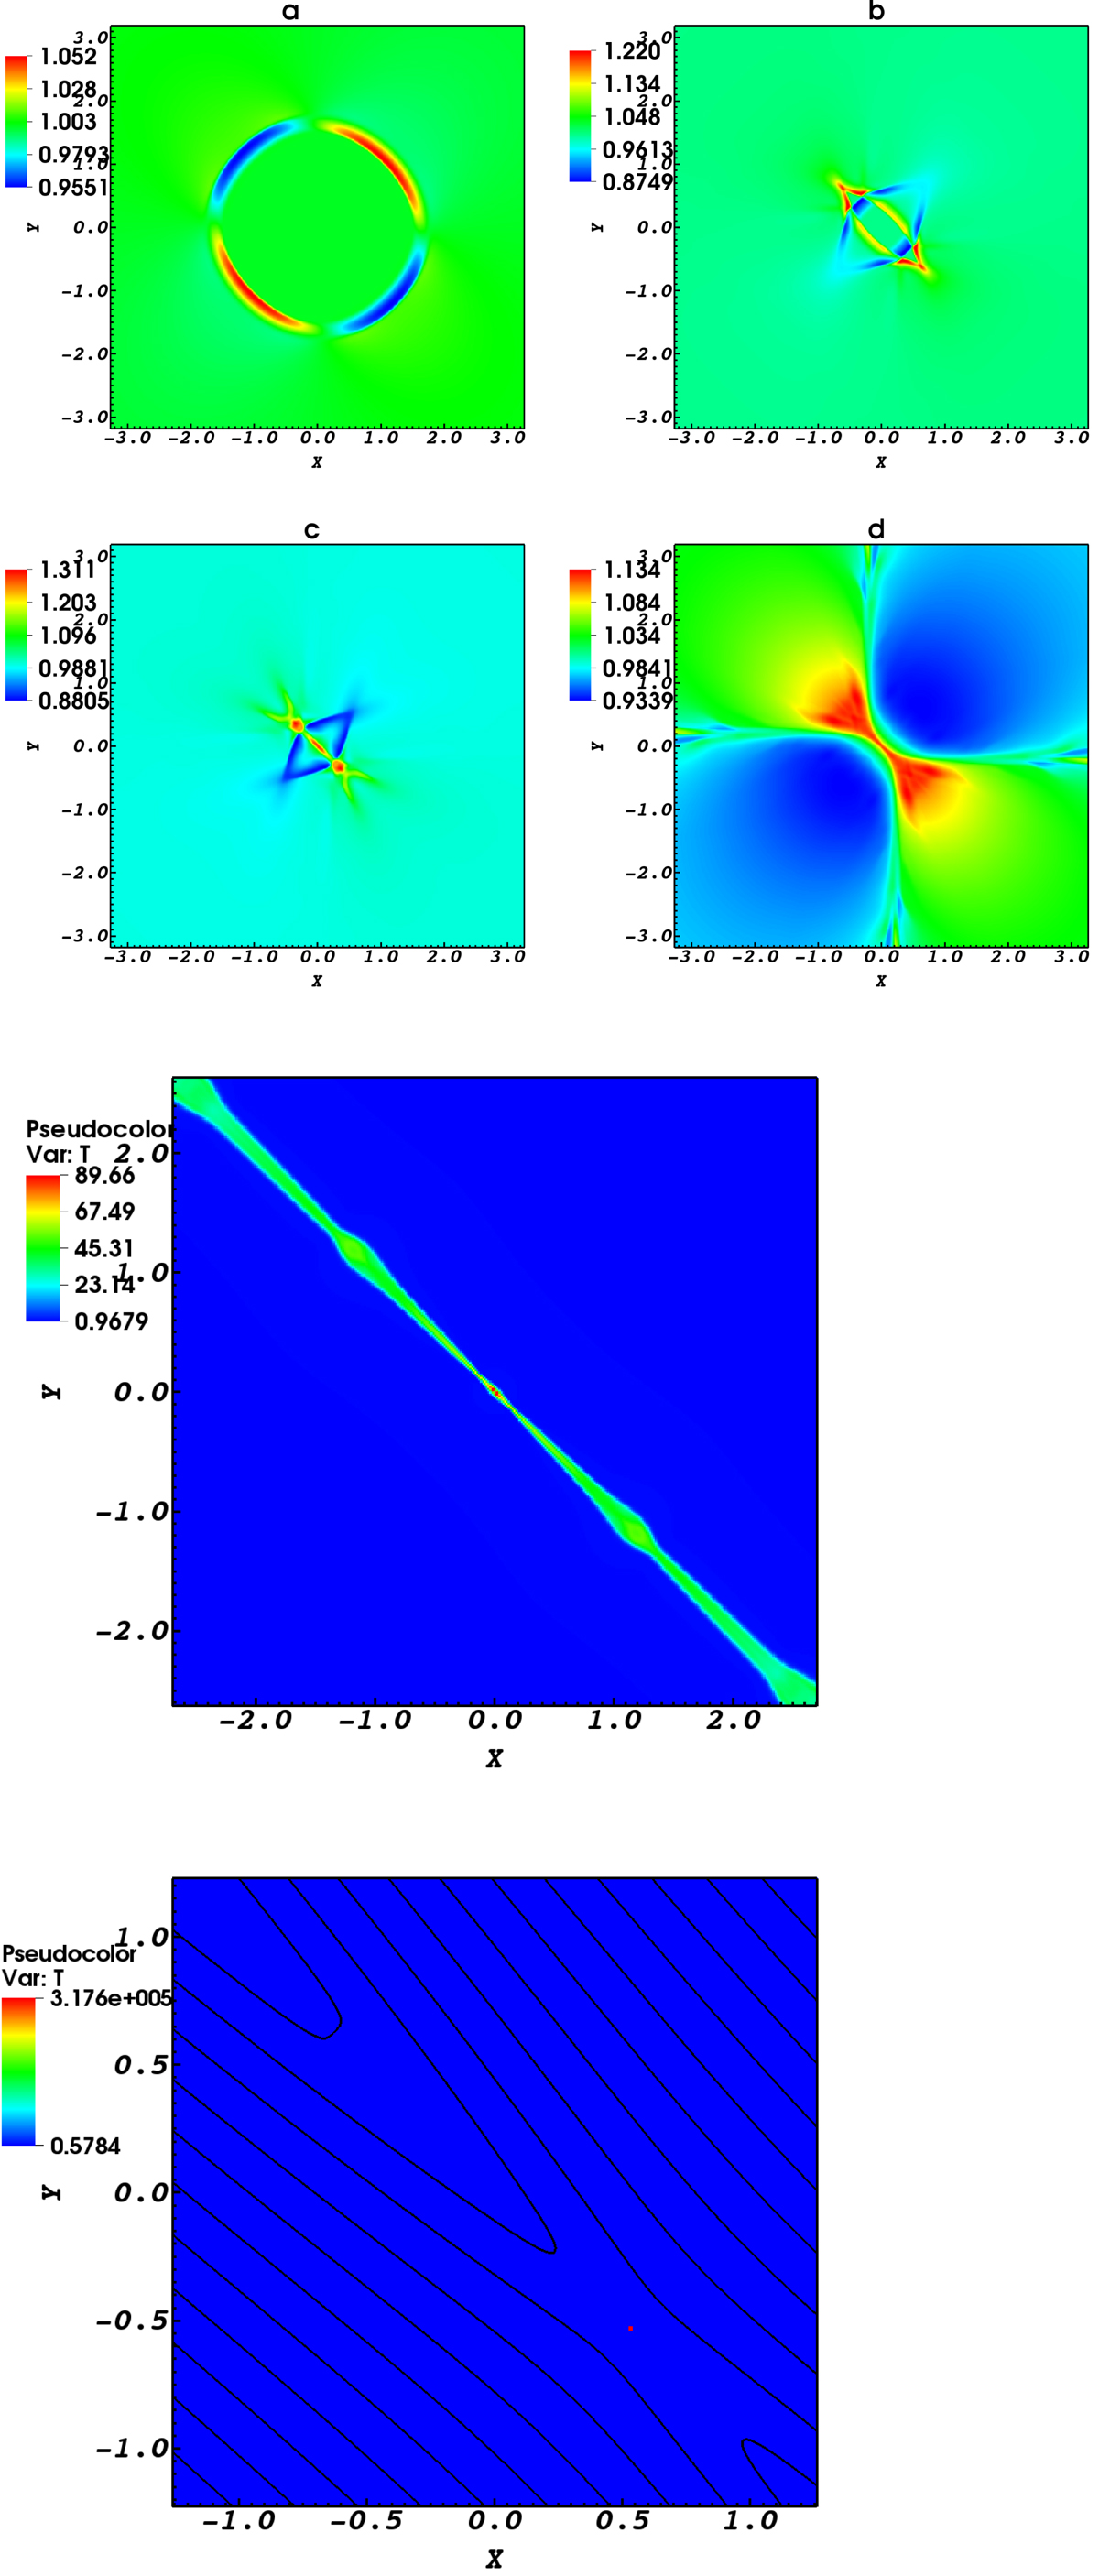
Spatial variation of the temperature. Contours a till b show the gradual increase of temperature for −3.3 ≤ x ≤ 3.3, −3.2 ≤ x ≤ 3.2 (a at t = 0.6 s, b at t = 1.14 s, c at t = 1.3 s and d at t = 3.52 s). The significant increase in plasma temperature is shown in the last two plots respectively at t = 6.02 s for −2.7 ≤ x ≤ 2.7, −2.6 ≤ x ≤ 2.6 and t = 7.6 s for −1.5 ≤ x ≤ 1.5, −1.5 ≤ x ≤ 1.5. This increase due to the propagation of magneto-acoustic waves and their interaction with the magnetic configuration. The black lines in the lower figure denote magnetic field lines.
Current usage metrics show cumulative count of Article Views (full-text article views including HTML views, PDF and ePub downloads, according to the available data) and Abstracts Views on Vision4Press platform.
Data correspond to usage on the plateform after 2015. The current usage metrics is available 48-96 hours after online publication and is updated daily on week days.
Initial download of the metrics may take a while.