Fig. 3.
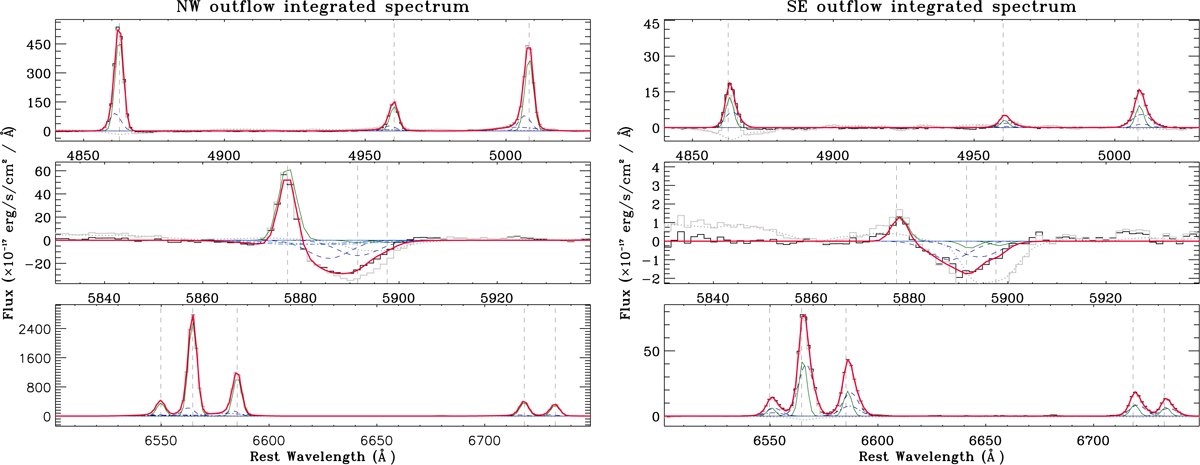
NW (left panel) and SE (right panel) outflow-integrated spectra extracted from the spaxels associated with high-velocity gas in the neutral and/or ionised phases (ΔV02([O III]) < −550 km s−1 and/or ΔV02(Na ID) < − 900 km s−1, for the NW system; ΔV98([O III]) > 450 km s−1 and/or ΔV02(Na ID) < − 750 km s−1, for the SE galaxy; see Sect. 4.2). The shell-like region spaxels are not included in these integrated spectra. The stellar continuum emission has been previously modelled and subtracted from each spaxel. The red curves overplotted on the spectra represent the best-fit solutions that reproduce the line profiles; NC and OC Gaussians are also shown as in Fig. 2. The outflow-integrated spectra extracted from the original MaNGA datacube (hence without pPXF best-fit model subtraction) and the integrated pPXF best-fit spectra are also shown in the figure with solid and dotted grey curves, respectively. For the two grey curves we applied a downward shift for visualisation purposes.
Current usage metrics show cumulative count of Article Views (full-text article views including HTML views, PDF and ePub downloads, according to the available data) and Abstracts Views on Vision4Press platform.
Data correspond to usage on the plateform after 2015. The current usage metrics is available 48-96 hours after online publication and is updated daily on week days.
Initial download of the metrics may take a while.