Fig. 11.
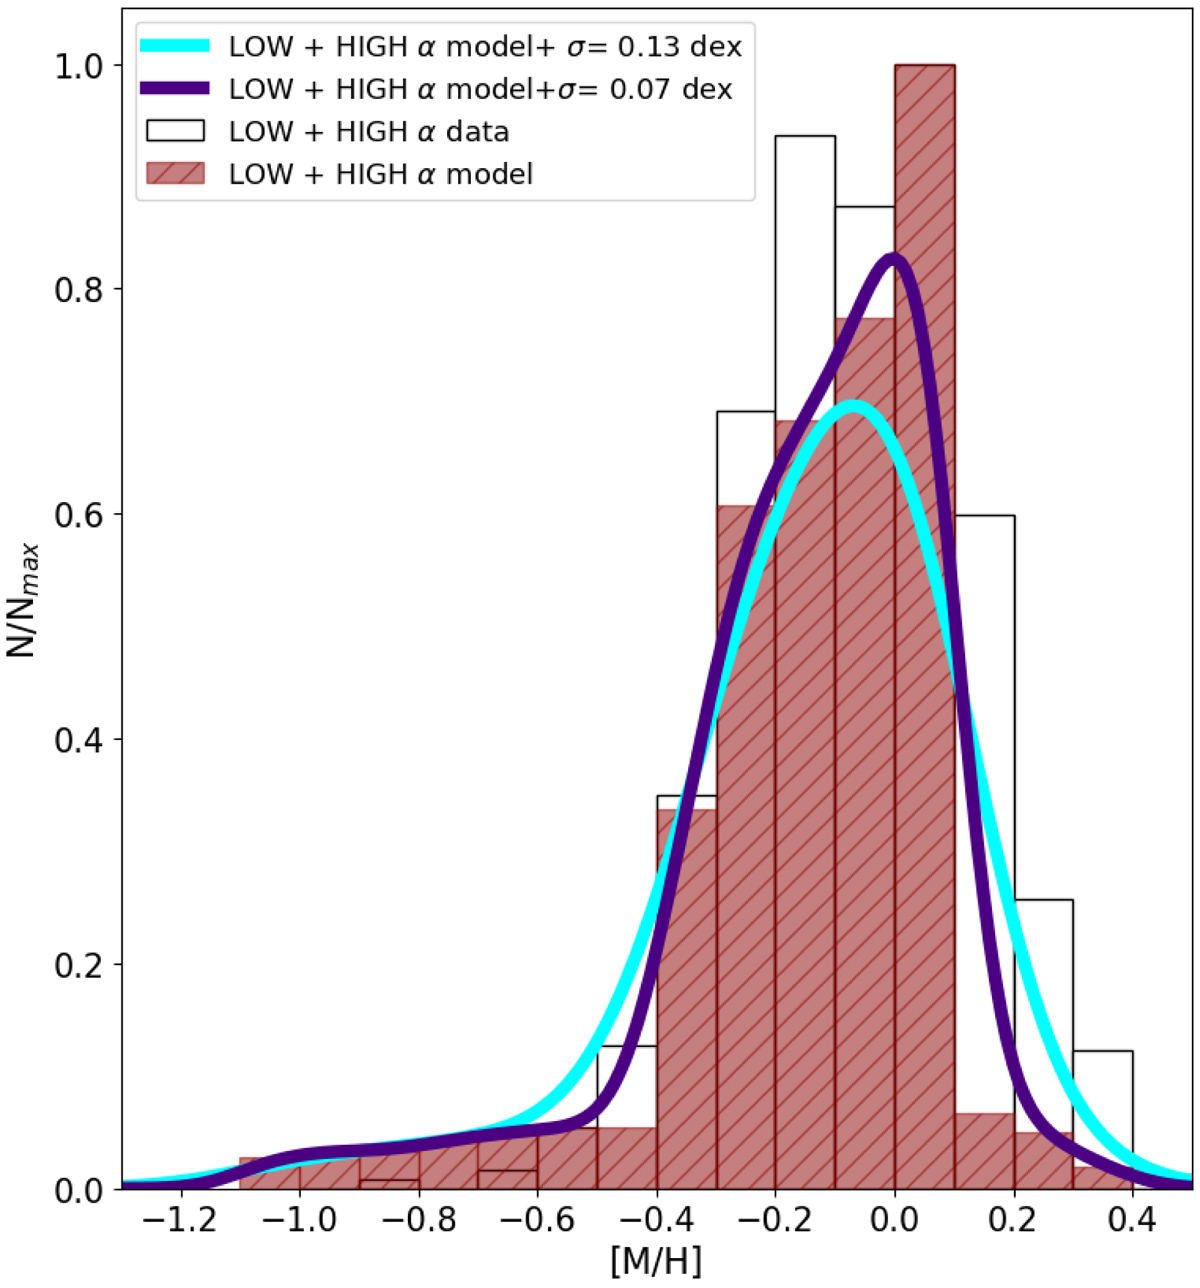
Metallicity distribution predicted by our chemical evolution model indicated by the red histogram. The observed distribution calculated including both high-α and low-α stars is shown by the black, empty histogram. The cyan line indicates the metallicity distribution of our chemical evolution model convolved with a Gaussian with standard deviation σ = 0.13 dex. Finally, the purple line indicates the metallicity distribution of our chemical evolution model convolved with a Gaussian with standard deviation σ = 0.07 dex.
Current usage metrics show cumulative count of Article Views (full-text article views including HTML views, PDF and ePub downloads, according to the available data) and Abstracts Views on Vision4Press platform.
Data correspond to usage on the plateform after 2015. The current usage metrics is available 48-96 hours after online publication and is updated daily on week days.
Initial download of the metrics may take a while.