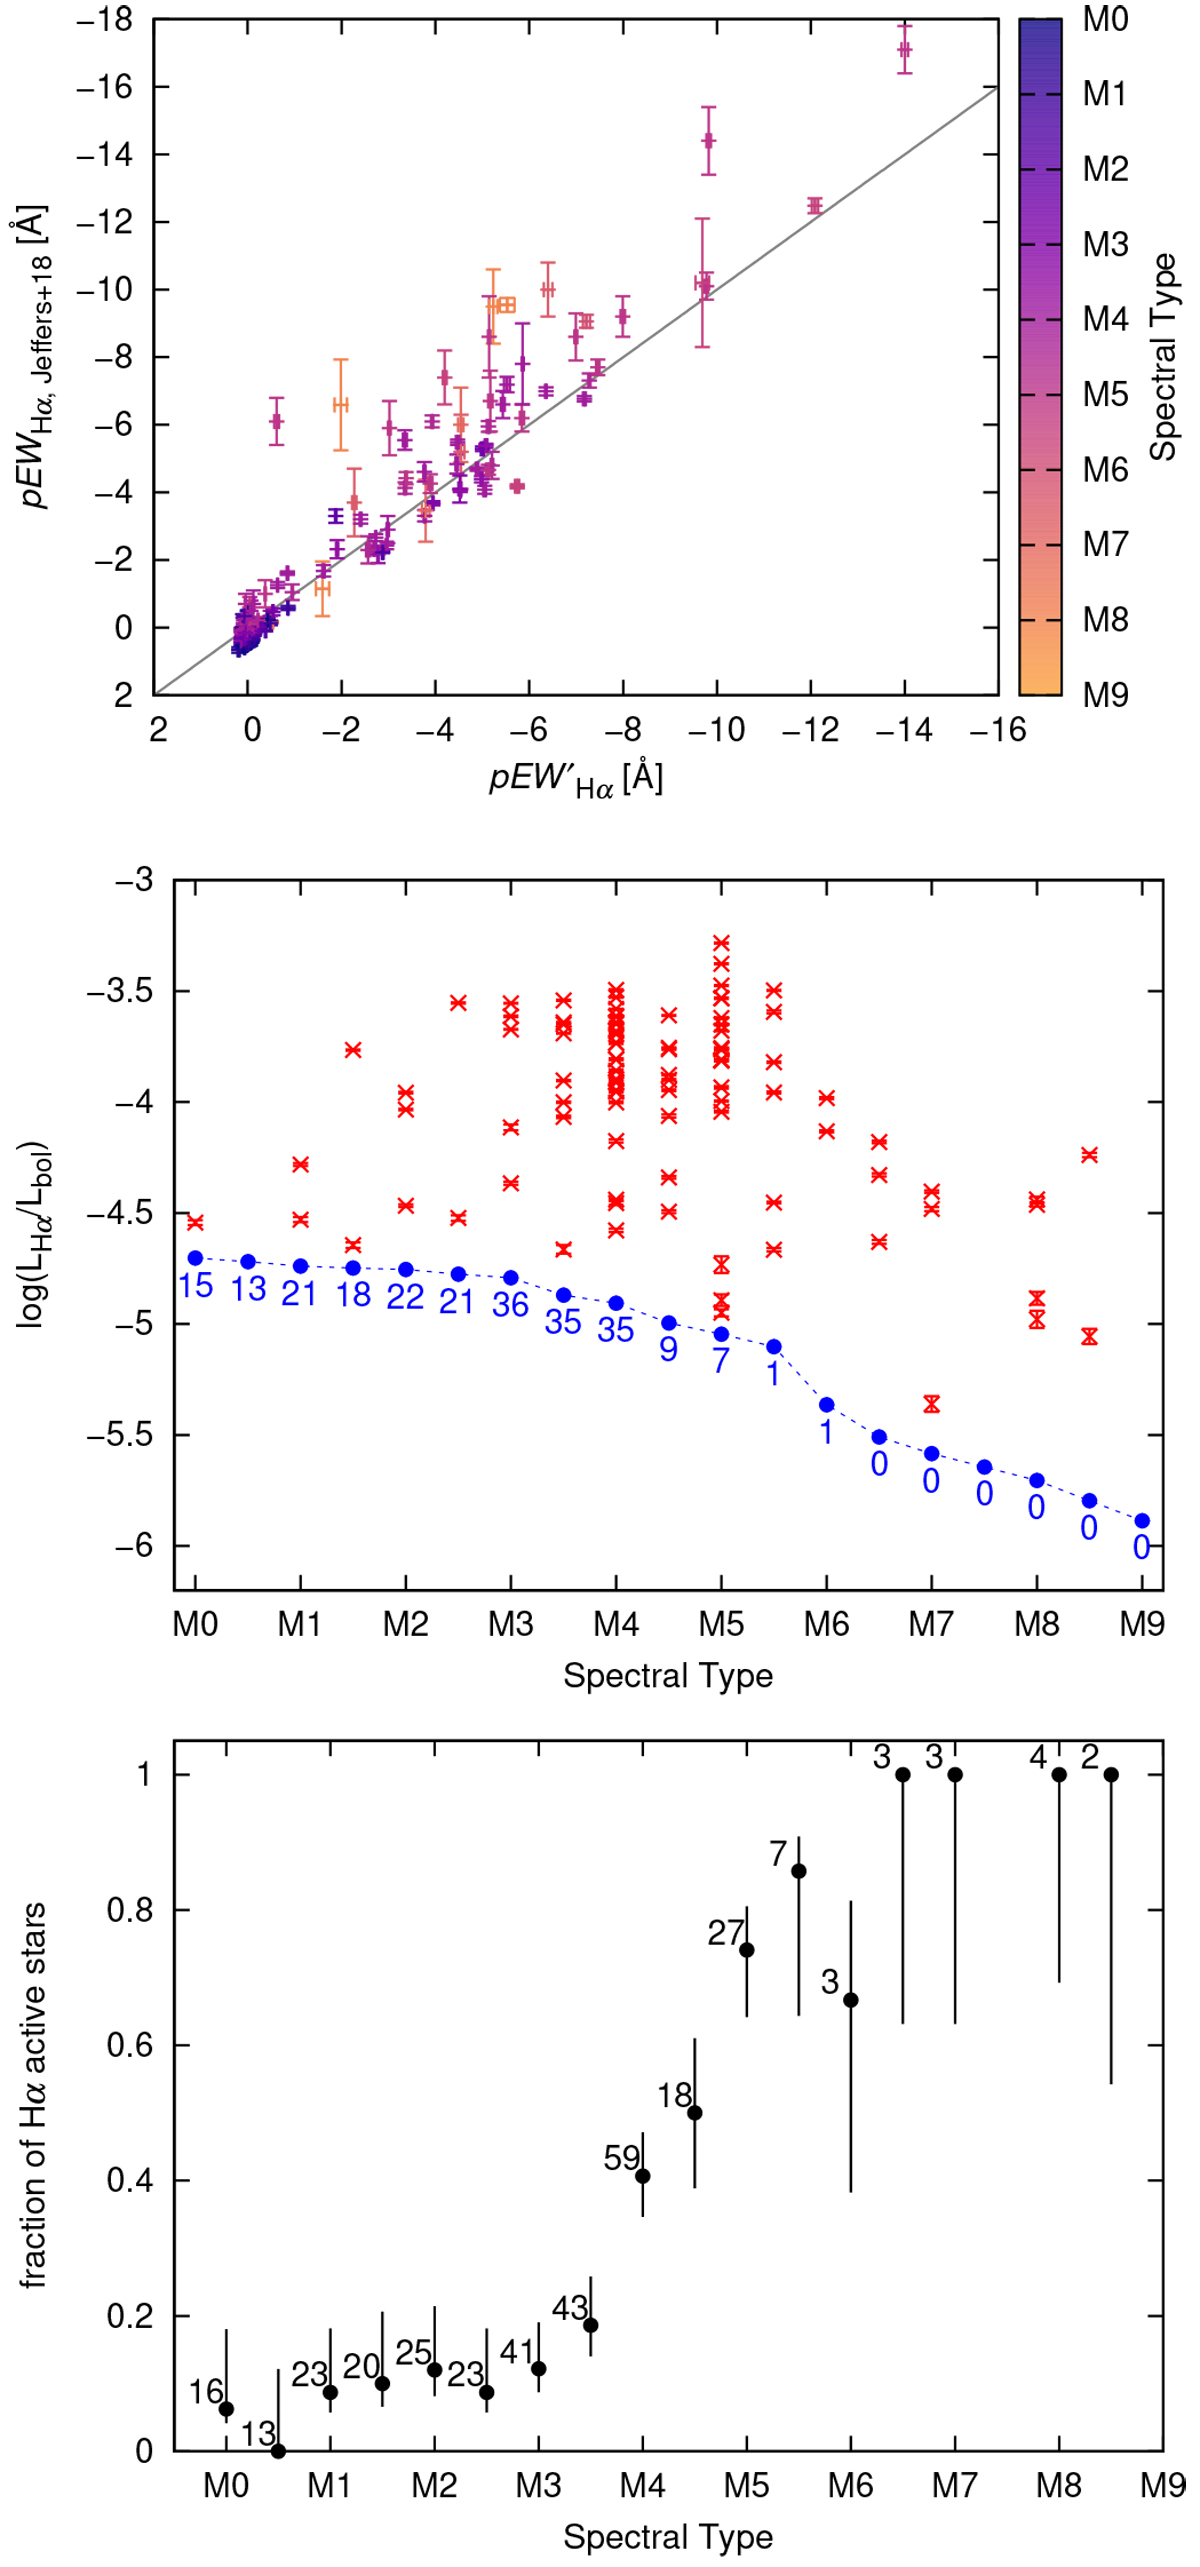
Fig. 6.

Top panel: comparison of our ![]() values with the pEWHα values from Jeffers et al. (2018). Colours denote spectral types. Middle panel: normalised Hα luminosity of active stars as a function of spectral type (red crosses). The blue circles indicate our activity threshold of
values with the pEWHα values from Jeffers et al. (2018). Colours denote spectral types. Middle panel: normalised Hα luminosity of active stars as a function of spectral type (red crosses). The blue circles indicate our activity threshold of ![]() Å, and the numbers reflect the number of stars below this threshold. Bottom panel: fraction of Hα active stars per spectral subtype for the 331 stars of our sample with error bars from binomial statistics. Numbers reflect the total number of sample stars in the corresponding bin.
Å, and the numbers reflect the number of stars below this threshold. Bottom panel: fraction of Hα active stars per spectral subtype for the 331 stars of our sample with error bars from binomial statistics. Numbers reflect the total number of sample stars in the corresponding bin.
Current usage metrics show cumulative count of Article Views (full-text article views including HTML views, PDF and ePub downloads, according to the available data) and Abstracts Views on Vision4Press platform.
Data correspond to usage on the plateform after 2015. The current usage metrics is available 48-96 hours after online publication and is updated daily on week days.
Initial download of the metrics may take a while.


