Fig. 2.
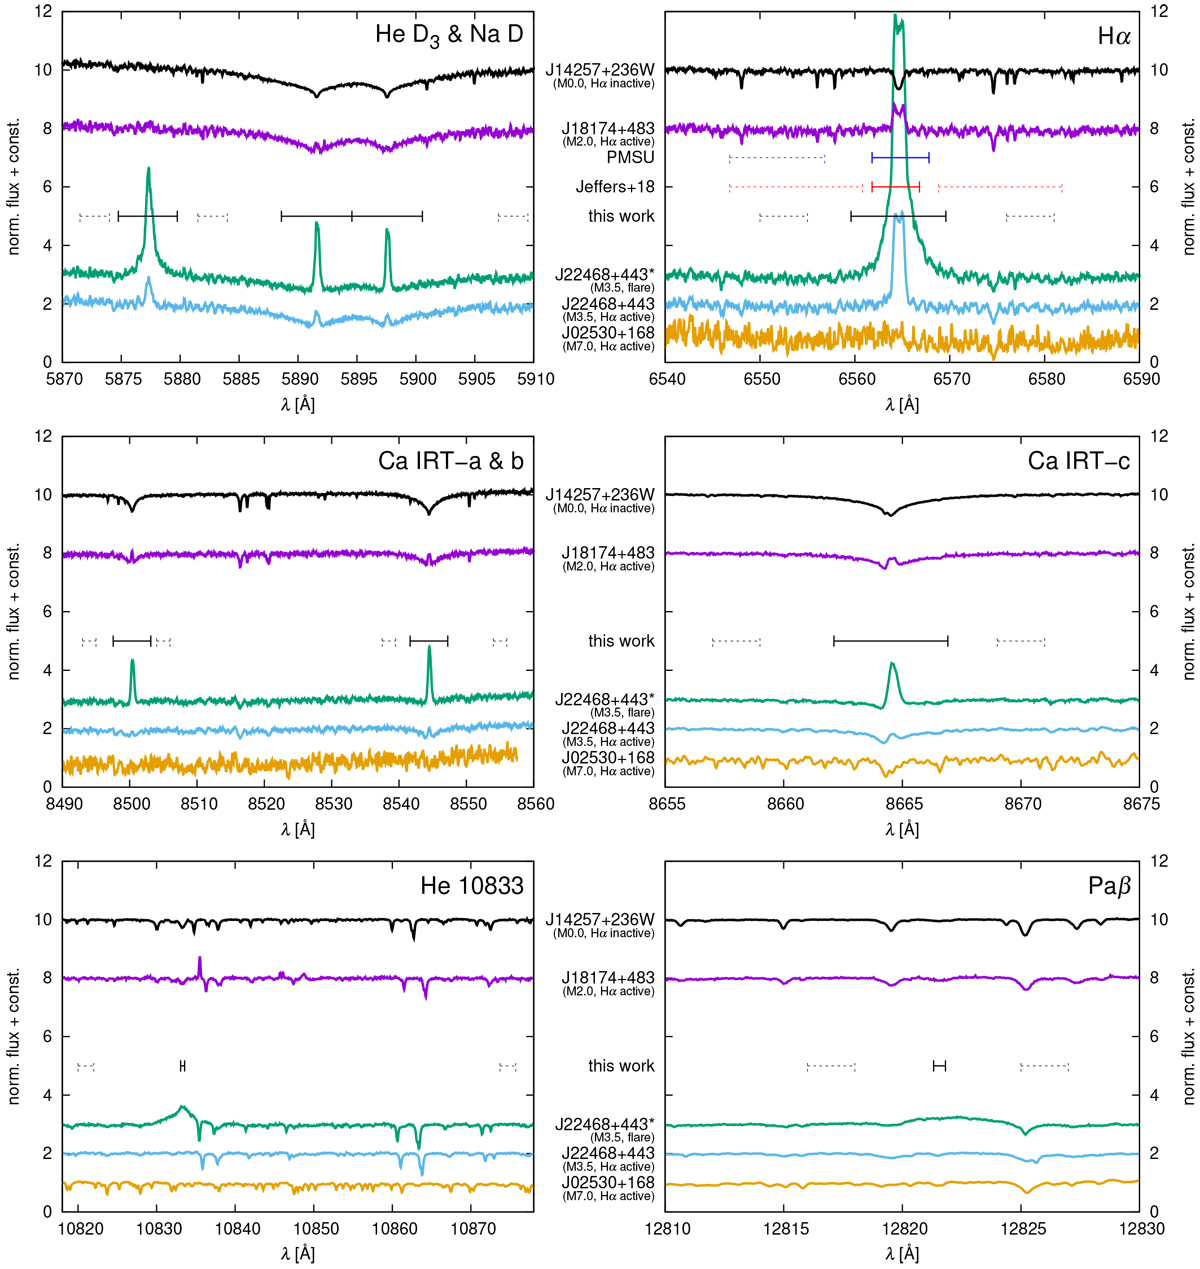
Selected spectra in regions around the considered chromospheric lines: an inactive M0.0 star (J14257+236W, black), a moderately active M2.0 star (J18174+483, purple), a very active M3.5 star (J22468+443) in flaring (green) and quiescent state (blue), and a moderately active M7.0 star (J02530+168, orange). The region around the He D3 and Na D lines (top left panel) in the M7.0 spectrum is not shown because of a low signal-to-noise ratio. Bars mark the line windowranges (solid) and pseudo-continuum ranges (dashed) as given in Table 1. In the case of Hα, we also show the line window and pseudo-continuum ranges used by Jeffers et al. (2018; red) and by Reid et al. (1995) and Alonso-Floriano et al. (2015; blue).
Current usage metrics show cumulative count of Article Views (full-text article views including HTML views, PDF and ePub downloads, according to the available data) and Abstracts Views on Vision4Press platform.
Data correspond to usage on the plateform after 2015. The current usage metrics is available 48-96 hours after online publication and is updated daily on week days.
Initial download of the metrics may take a while.