Fig. 2.
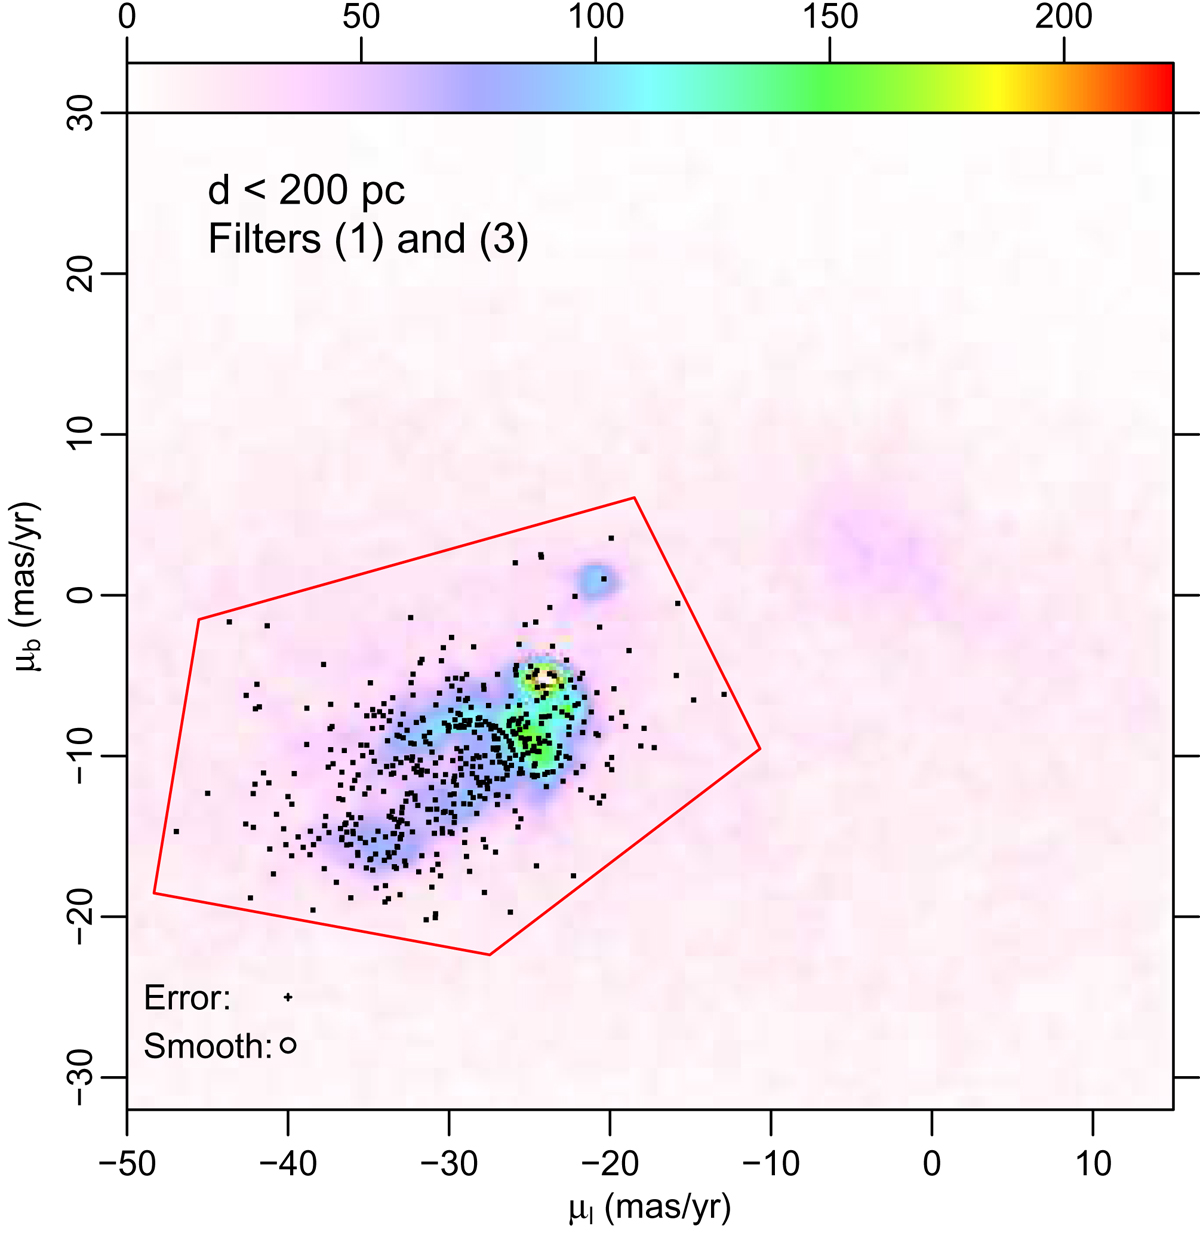
Density plot (2D histogram) of Gaia sources in the PM plane (μl, μb) in Galactic coordinates, with parallax π > 5 and relative error on parallax π/Δπ > 10, Gaussian-smoothed, and with filters (1) and (3) applied (see Sect. 2 for details). The circle at (μl, μb) = (−40, −28) indicates the 1 − σ size of the smoothing Gaussian. The small cross at (μl, μb) = (−40, −25) represents the median PM error. Black dots indicate the HIPPARCOS Sco OB2 likely members from de Zeeuw et al. (1999). The color scale on the top axis indicates source density is in units of sources/(mas/yr)2. The red polygon enclosing all HIPPARCOS members defines the extraction region of PM-selected Gaia Sco OB2 candidate members.
Current usage metrics show cumulative count of Article Views (full-text article views including HTML views, PDF and ePub downloads, according to the available data) and Abstracts Views on Vision4Press platform.
Data correspond to usage on the plateform after 2015. The current usage metrics is available 48-96 hours after online publication and is updated daily on week days.
Initial download of the metrics may take a while.