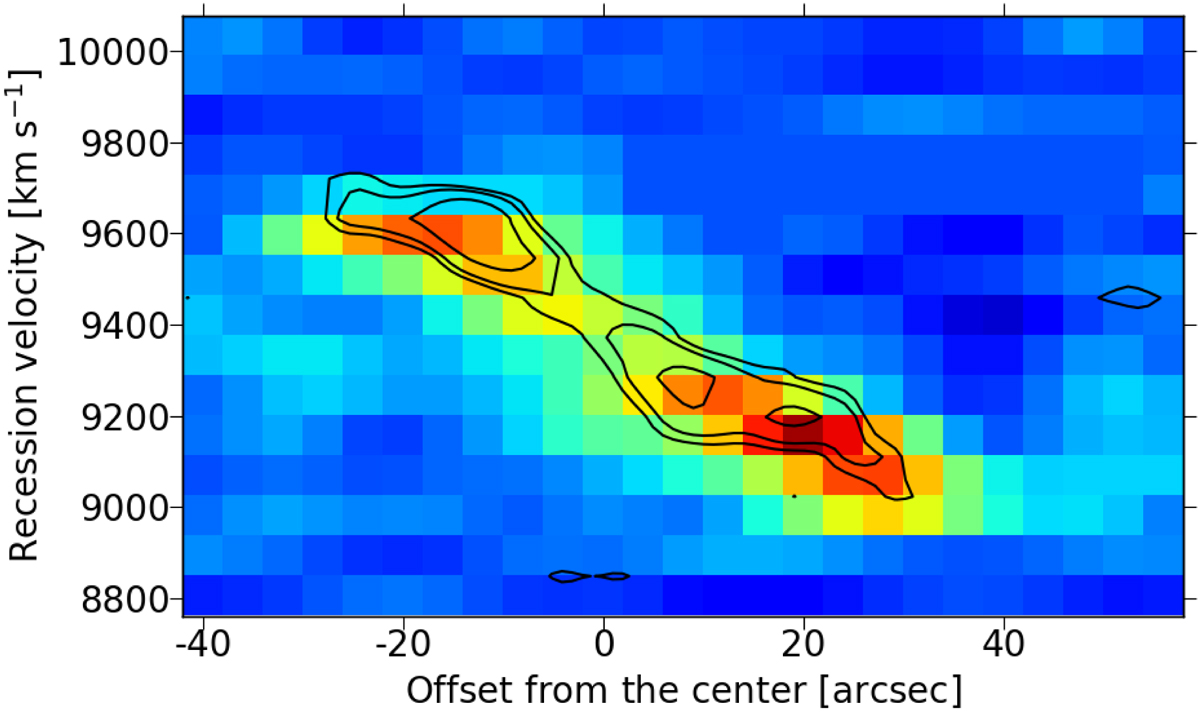
Fig. 7.
Download original image
Pv diagram of UGC 10214 from the HI data (colour) and the CO(1-0) data from CARMA (contours), taken along the major axis of UGC 10214 as in Fig. 3 with a slice width of 4″ on either side.
Current usage metrics show cumulative count of Article Views (full-text article views including HTML views, PDF and ePub downloads, according to the available data) and Abstracts Views on Vision4Press platform.
Data correspond to usage on the plateform after 2015. The current usage metrics is available 48-96 hours after online publication and is updated daily on week days.
Initial download of the metrics may take a while.