Fig. 7
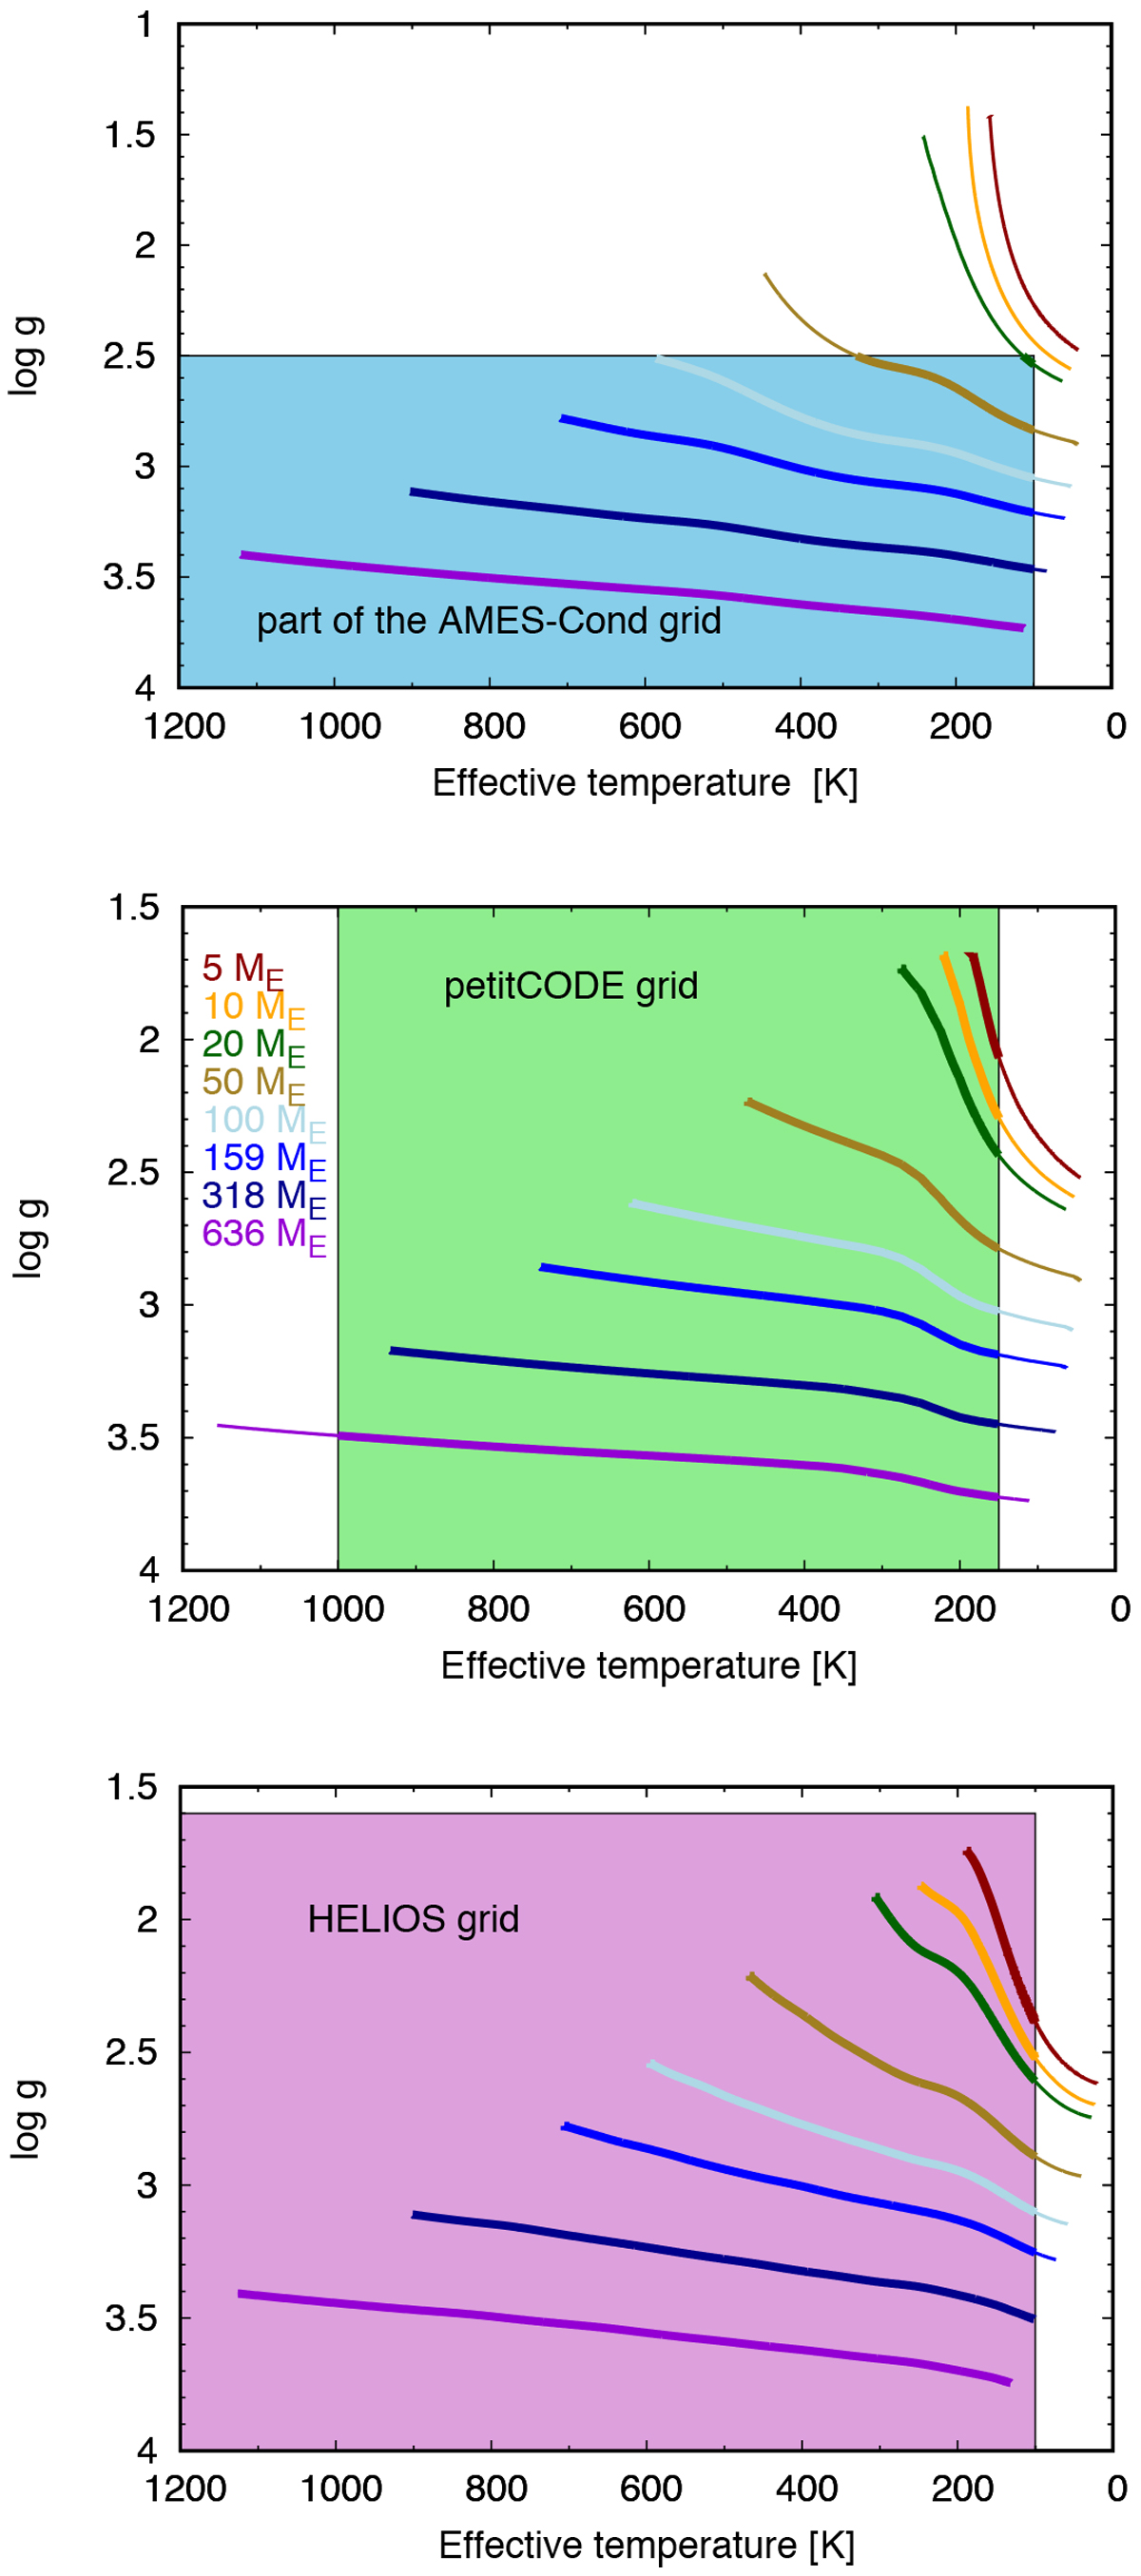
Evolution of the planets in the logg–Teff space, together with the coverage by the atmosphere grids given as rectangles. The colour code for the masses is given in the middle panel. Thick lines indicate cooling curves that are in the atmosphere grid and thin lines those that are outside of the grid. Top panel: evolution in the AMES-Cond grid. Middle panel: evolution in the petitCODE grid for the cloudy (fsed = 0.5) and solar metallicity atmosphere is shown. This is representative also for other types of petitCODE atmospheres. Bottom panel: evolution in the HELIOS grid for a cloud-free atmosphere with a [M/H] = 0.6 and is representative also for the solar -metallicity evolution paths.
Current usage metrics show cumulative count of Article Views (full-text article views including HTML views, PDF and ePub downloads, according to the available data) and Abstracts Views on Vision4Press platform.
Data correspond to usage on the plateform after 2015. The current usage metrics is available 48-96 hours after online publication and is updated daily on week days.
Initial download of the metrics may take a while.