Fig. 6
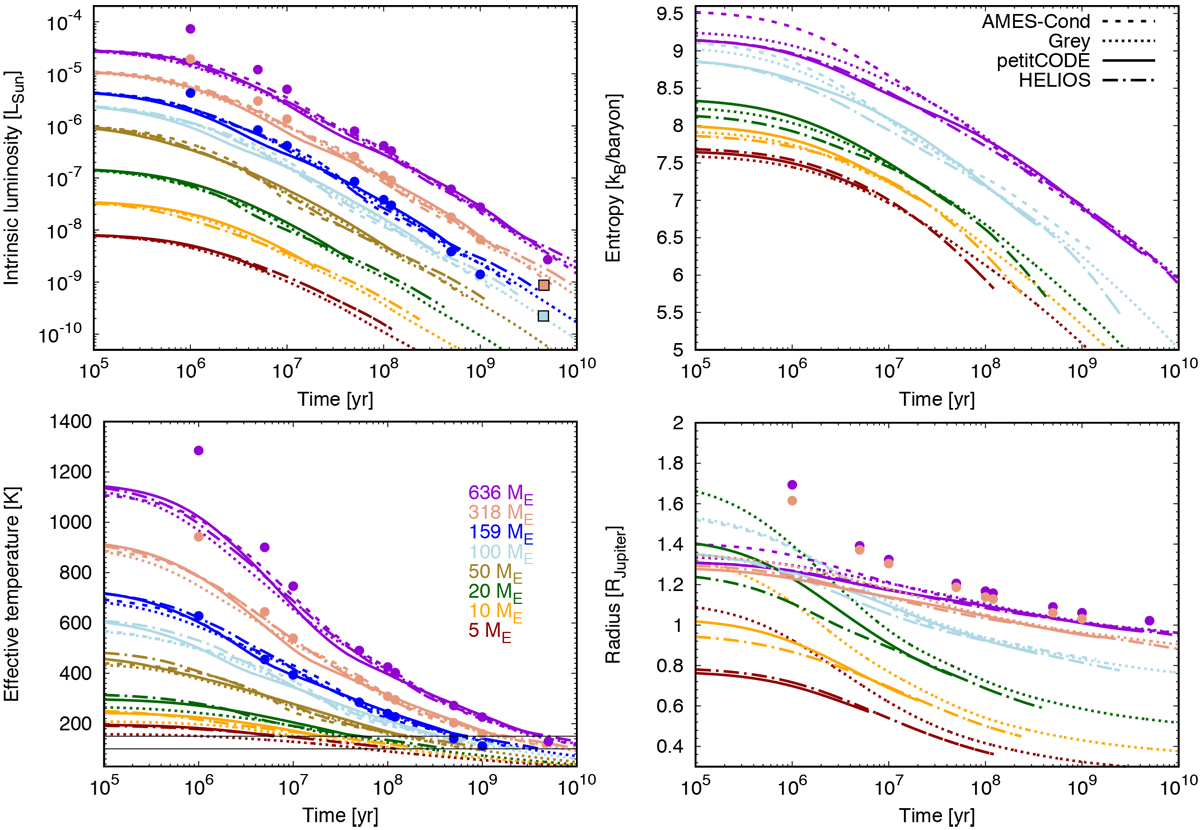
Temporal evolution of fundamental properties of the eight simulated planets with initial conditions given in Table 2. The change in intrinsic luminosity, entropy, temperature, and radius is shown. The colour code for the masses is given in the bottom left panel. The luminosities of Jupiter and Saturn are indicated as squares in the top left panel. The dots in the luminosity, effective temperature, and radius panel show the results from Baraffe et al. (2003). Solid lines show the evolution with a cloud-free atmosphere with solar metallicity from the petitCODE grid, dashed lines show it with an AMES-Cond atmosphere, dash-dotted lines show it with a solar metallicity, cloud-free atmosphere from the HELIOS grid, and dotted lines finally show the evolution calculated with a grey atmosphere.Since the three smallest masses are evolving outside of the AMES-Cond grid (see Fig. 7), these masses are not plotted for an AMES-Cond atmosphere. For the AMES-Cond, petitCODE and HELIOS atmospheres, the tracks are shown as long as the planet is evolving on the atmospheric grid. For better visibility, three resp. two evolution curves are not shown in the entropy resp. radius plot. The horizontal lines at 100 and 150 K in the Teff plot show the lower limit of the HELIOS and petitCODE grid, respectively.
Current usage metrics show cumulative count of Article Views (full-text article views including HTML views, PDF and ePub downloads, according to the available data) and Abstracts Views on Vision4Press platform.
Data correspond to usage on the plateform after 2015. The current usage metrics is available 48-96 hours after online publication and is updated daily on week days.
Initial download of the metrics may take a while.