Fig. 3
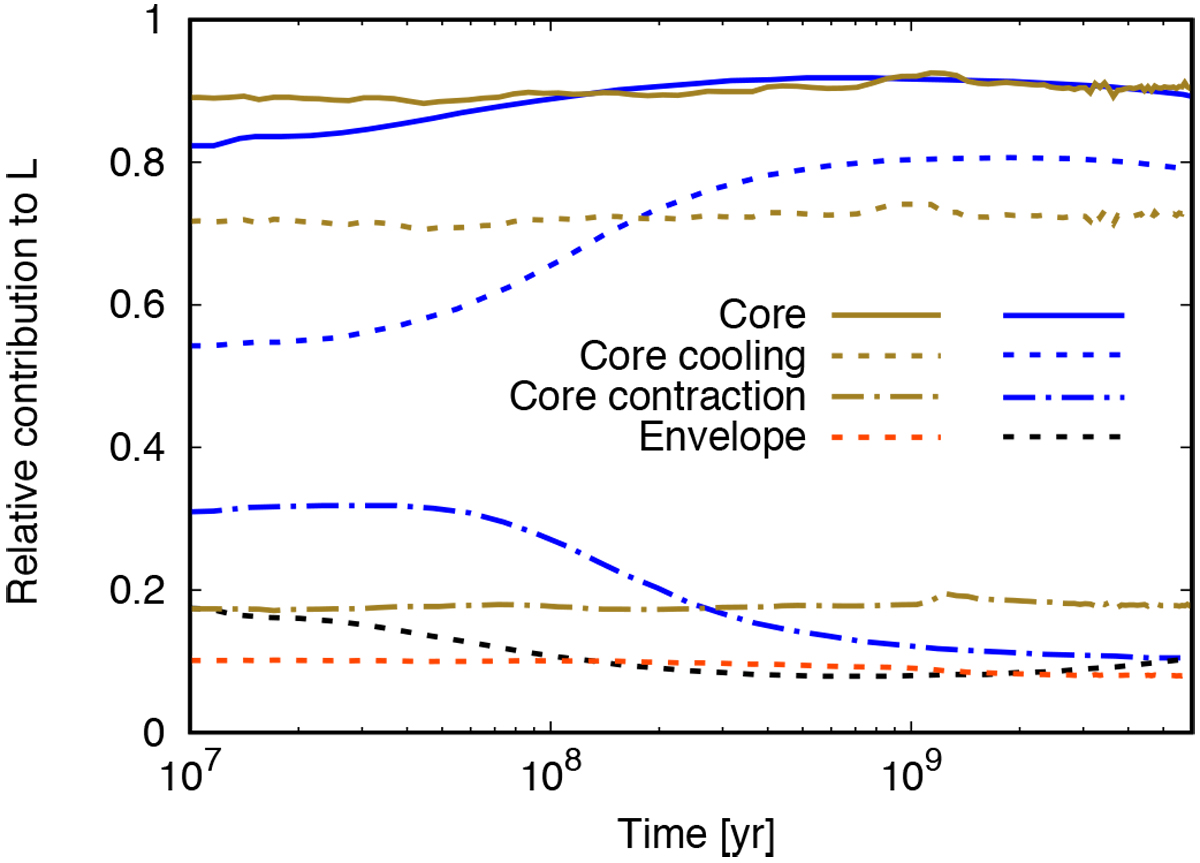
Relative contributions to the total luminosity L over time for the water core simulation of GJ 436 b. The blue and black lines are from Baraffe (2015; priv. comm.), the red and brown lines are from this work and represent the following: solid blue/ brown line: energy release from the core, which is the sum of core cooling and core contraction; dashed blue/ brown line: core cooling; dash-dotted blue/ brown line: core contraction; dashed black/ red line: envelope cooling and contraction. A discussion can be found in Sect. 4.3.
Current usage metrics show cumulative count of Article Views (full-text article views including HTML views, PDF and ePub downloads, according to the available data) and Abstracts Views on Vision4Press platform.
Data correspond to usage on the plateform after 2015. The current usage metrics is available 48-96 hours after online publication and is updated daily on week days.
Initial download of the metrics may take a while.