Fig. 13
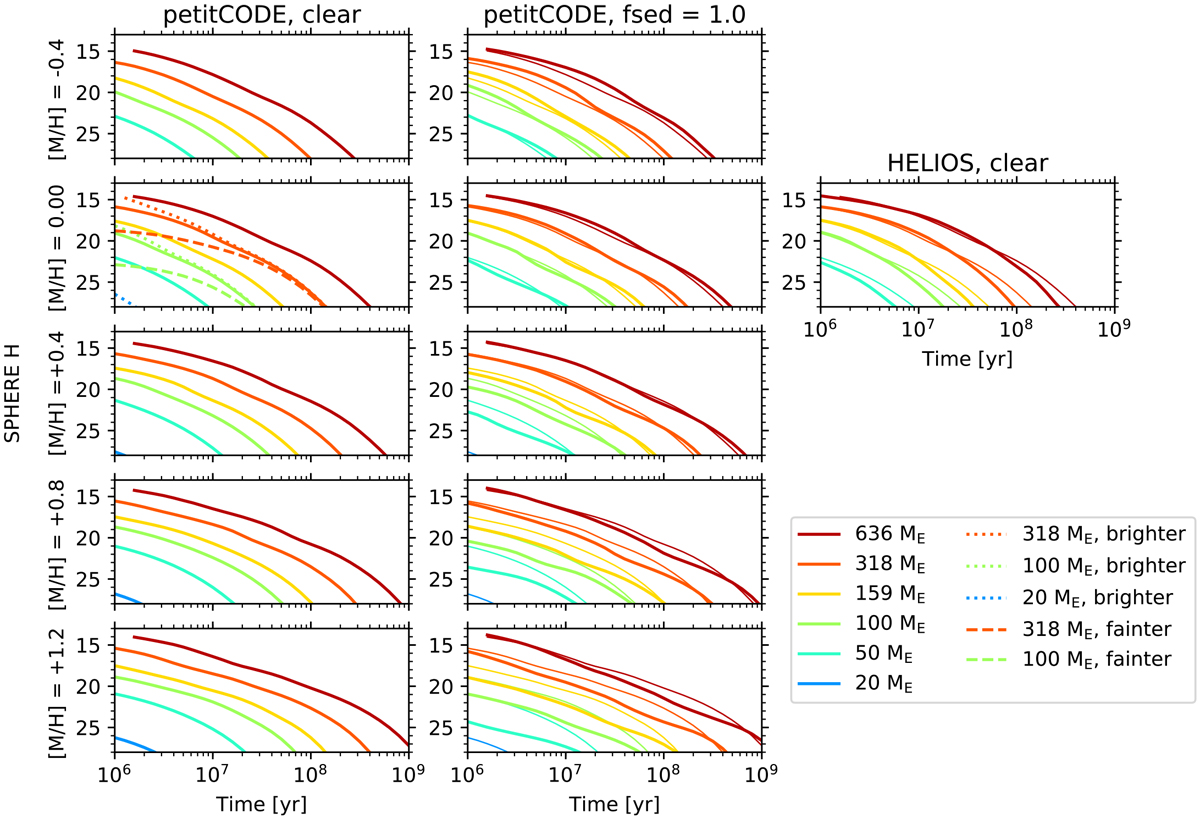
Overview of all evolutionary models that were calculated for this work. As an example, the SPHERE/IRDIS H band magnitude is shown. Some of the lower mass planets might not be visible on the axis range chosen here. The petitCODE grid clear magnitudes for the nominal post formation luminosity that are shown as thick solid lines in the first column are repeated in the other panels as thin lines for comparison between clear versus cloudy cases. In the clear solar metallicity panel (first panel, second row), we also show the magnitudes corresponding to an evolution with a ten times higherpost formation luminosity (brighter, dotted) and with a ten times lower post formation luminosity (fainter, dashed) than the nominal case. This simulations were introduced in Sect. 6.3. The magnitudes are only shown as long as the planets evolve in the atmospheric grid, and for the cloudy models as long as they are above 200 K.
Current usage metrics show cumulative count of Article Views (full-text article views including HTML views, PDF and ePub downloads, according to the available data) and Abstracts Views on Vision4Press platform.
Data correspond to usage on the plateform after 2015. The current usage metrics is available 48-96 hours after online publication and is updated daily on week days.
Initial download of the metrics may take a while.