Fig. 6.
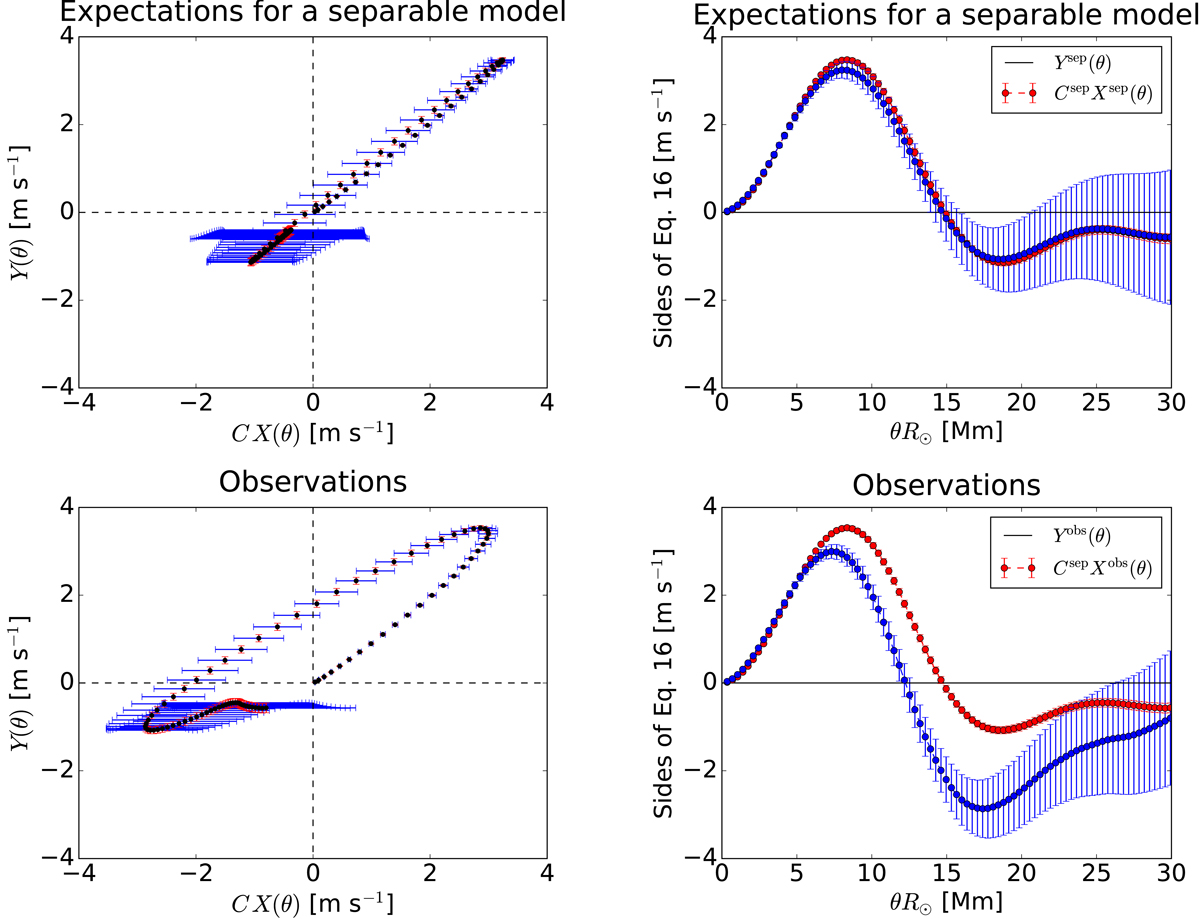
Top-left panel: left-hand side Ysep(θ) of Eq. (15) as a function of the right-hand side CsepXsep(θ) of Eq. (15) for a separable model. Bottom-left panel: left-hand side Yobs(θ) of Eq. (15) as a function of the right-hand side CsepXobs(θ) of Eq. (15) for the observations. Top right panel: left-hand side Ysep(θ) and right-hand side CsepXsep(θ) of Eq. (15) as a function of distance for a separable model. Bottom right panel: left-hand side Yobs(θ) and right-hand side CsepXobs(θ) of Eq. (15) as a function of distance for the observations. We show angular distances up to 30 Mm where the supergranular velocities are largest. Further away from the center of the supergranule, both X(θ) and Y(θ) go to zero. In all panels the errors are 3σ. In all panels, blue error bars and curves correspond to the right-hand side of Eq. (15) and red error bars and curves correspond to the left-hand side of Eq. (15).
Current usage metrics show cumulative count of Article Views (full-text article views including HTML views, PDF and ePub downloads, according to the available data) and Abstracts Views on Vision4Press platform.
Data correspond to usage on the plateform after 2015. The current usage metrics is available 48-96 hours after online publication and is updated daily on week days.
Initial download of the metrics may take a while.