Fig. 4.
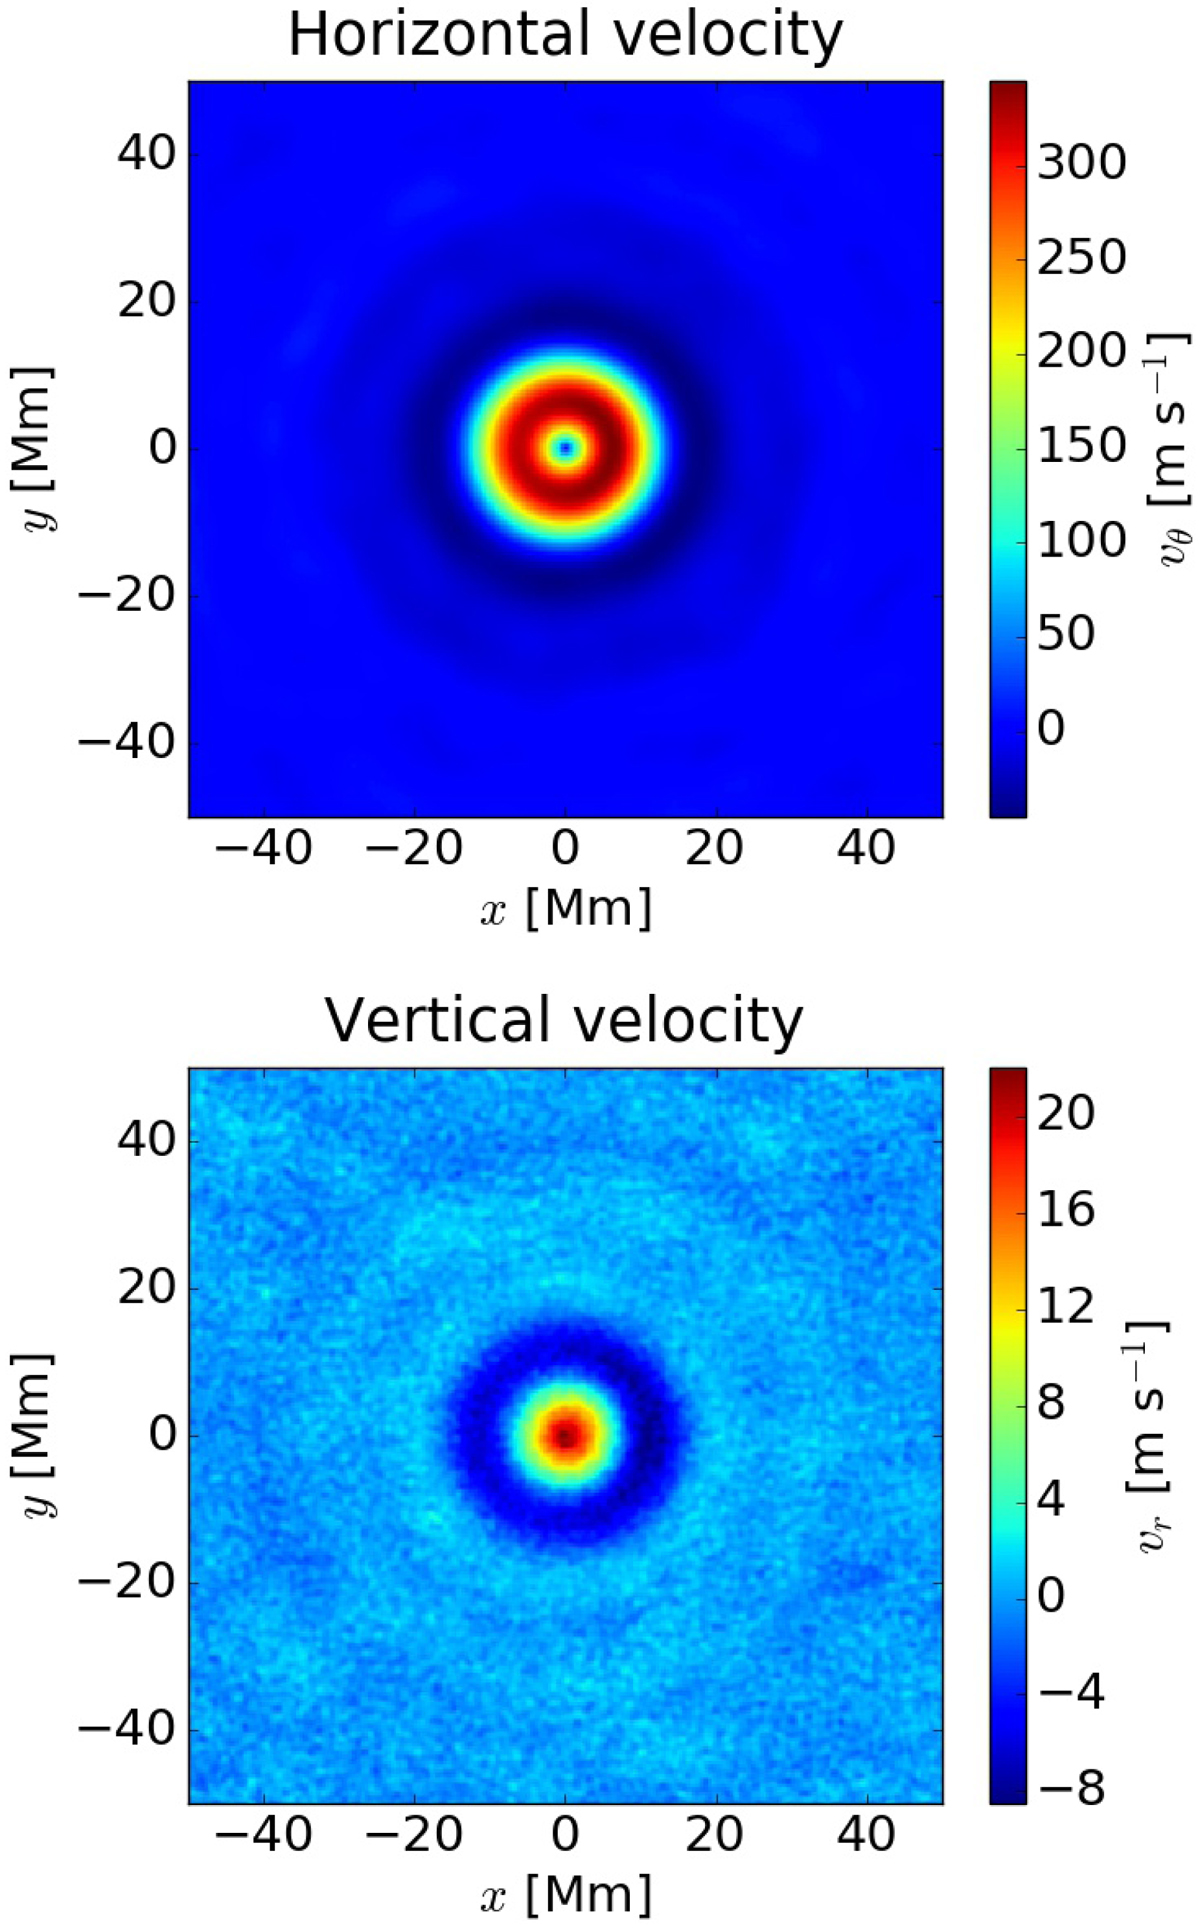
Horizontal (top panel) and vertical (bottom panel) components of the velocity at the surface. The x coordinate is in the east-west direction (pointed westwards), the y coordinate is in the north-south direction (pointed northwards). The maps are centered at the center of the supergranule. Red indicates outflows (horizontal component) and upflows (vertical component).
Current usage metrics show cumulative count of Article Views (full-text article views including HTML views, PDF and ePub downloads, according to the available data) and Abstracts Views on Vision4Press platform.
Data correspond to usage on the plateform after 2015. The current usage metrics is available 48-96 hours after online publication and is updated daily on week days.
Initial download of the metrics may take a while.