Fig. 2.
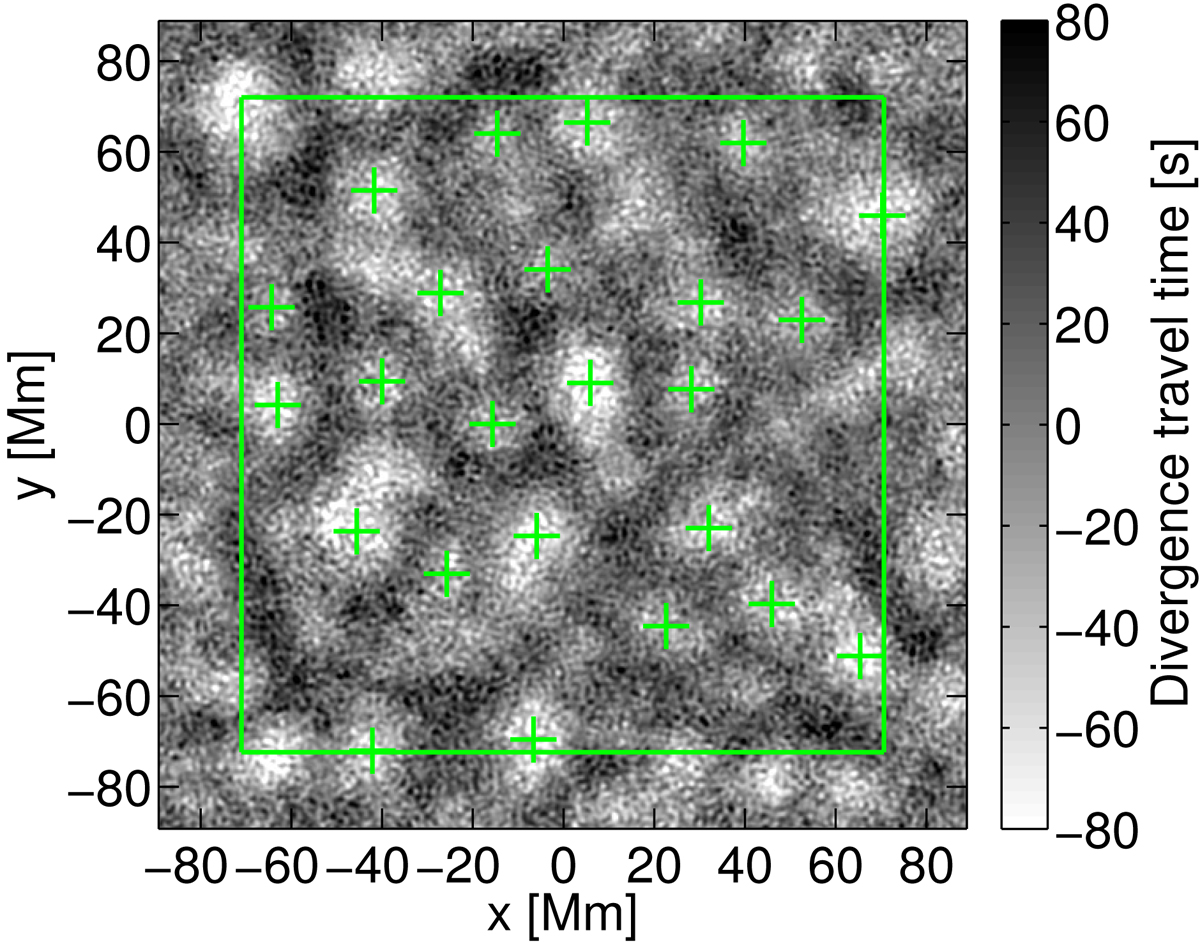
Identification of supergranules (green crosses) in an example 8 h map of divergence-sensitive f-mode travel times computed at the equator, near disk center, using the method in Langfellner et al. (2015a). The x coordinate is in the east-west direction (positive towards west), the y coordinate is in the north-south direction (positive towards north). The gray-scale indicates the value of the divergence-sensitive travel times from which we derive the position of the supergranules. White indicates outflows, black inflows.
Current usage metrics show cumulative count of Article Views (full-text article views including HTML views, PDF and ePub downloads, according to the available data) and Abstracts Views on Vision4Press platform.
Data correspond to usage on the plateform after 2015. The current usage metrics is available 48-96 hours after online publication and is updated daily on week days.
Initial download of the metrics may take a while.