Fig. C.4.
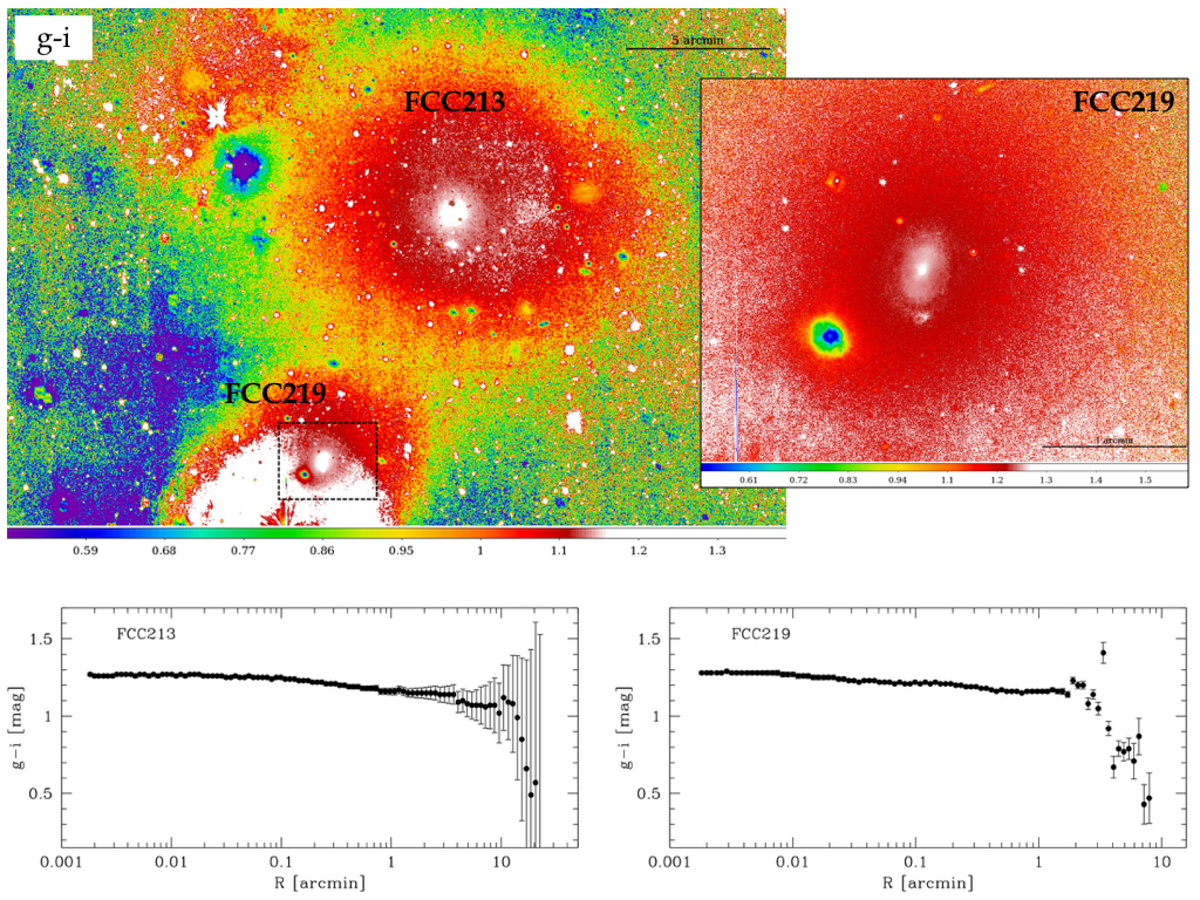
Colour map (top panels) and azimuthally averaged colour profiles (bottom panels), g − i, for the two bright ETGs in the core of the Fornax cluster, FCC213 and FCC219. The image size of the top left panel is 0.45 × 0.38°. In the top right panel there is an extracted image (3.4 × 2.6 arcmin) of FCC219 into the central regions (dashed box in the top left panel).
Current usage metrics show cumulative count of Article Views (full-text article views including HTML views, PDF and ePub downloads, according to the available data) and Abstracts Views on Vision4Press platform.
Data correspond to usage on the plateform after 2015. The current usage metrics is available 48-96 hours after online publication and is updated daily on week days.
Initial download of the metrics may take a while.