Fig. 3.
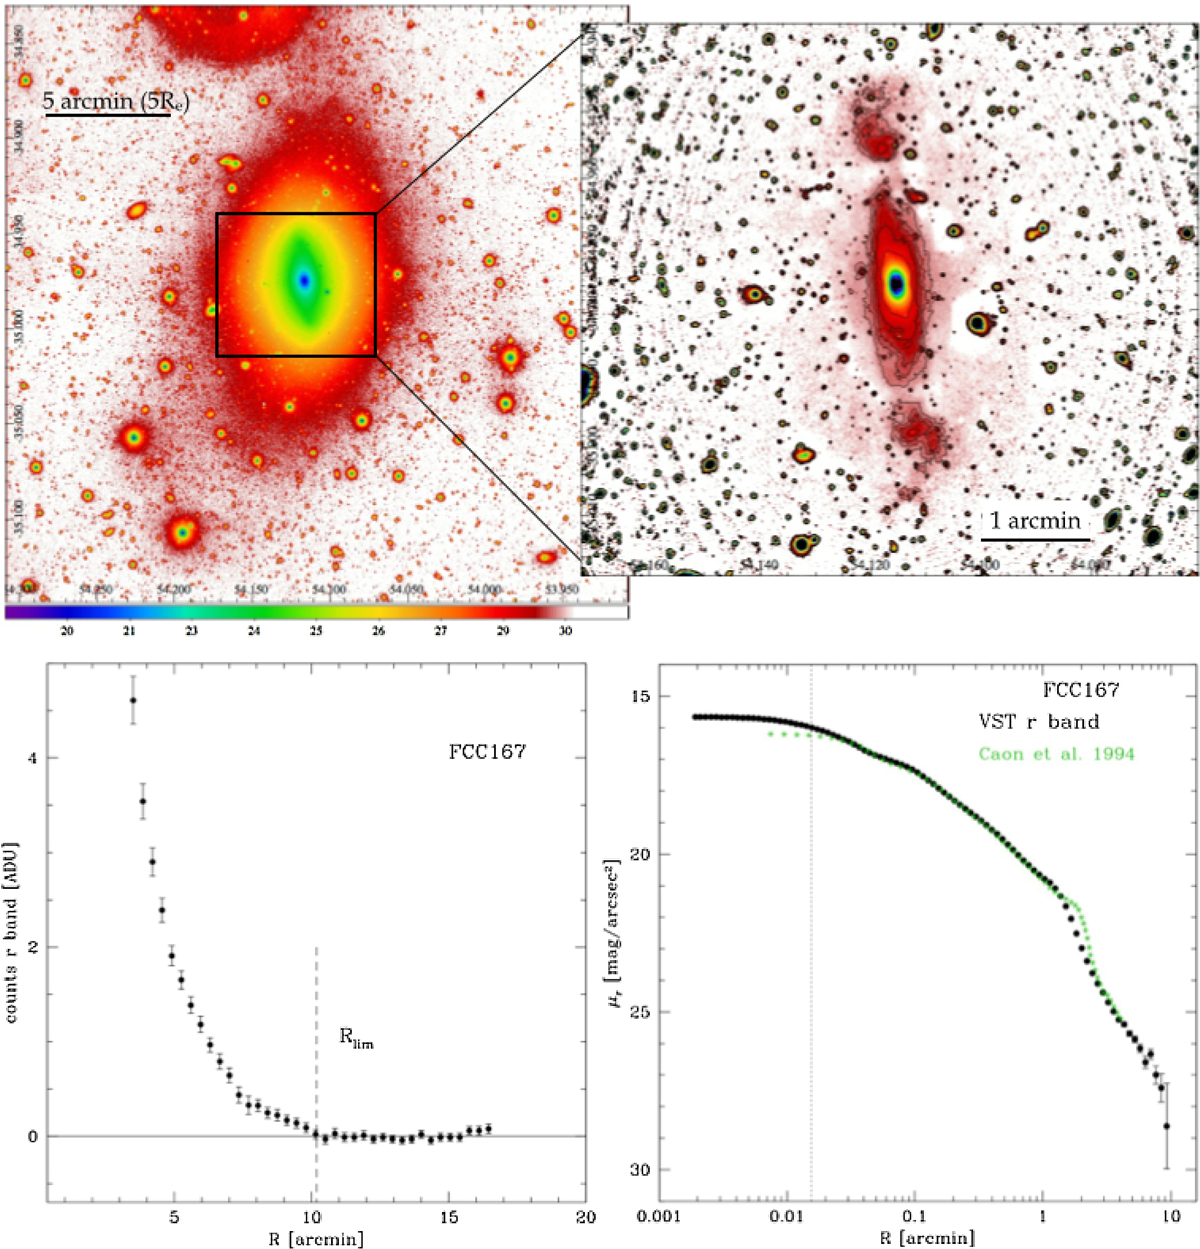
Top panels: extracted region of the VST mosaic of 0.34 × 0.34 square degrees around FCC 167 in r band (left), plotted in surface brightness levels (shown in the colour bar). High-frequency residual image obtained from the r-band VST image of FCC 167 (right). Lower panels: intensity profile (left), in the r band, in the outer regions of FCC 167. For R ≥ 10.2 arcmin, the galaxy’s light blends into the average sky level, which has a residual scatter of about 0.04 counts around the zero (continuous black line). Azimuthally-averaged surface brightness profiles of FCC 167 in the r band (right) derived from VST data (black points), compared with literature data from Caon et al. (1994) in the B band (green asterisks), transformed to r-band. The vertical dotted line (right panel) delimits the region where the light profiles are “flattened” due to the convolution effect with the point-spread function (PSF). The FWHM of the PSF is about 1 arcsec, which is the average seeing for FDS observations (see Table 1).
Current usage metrics show cumulative count of Article Views (full-text article views including HTML views, PDF and ePub downloads, according to the available data) and Abstracts Views on Vision4Press platform.
Data correspond to usage on the plateform after 2015. The current usage metrics is available 48-96 hours after online publication and is updated daily on week days.
Initial download of the metrics may take a while.