Fig. 8
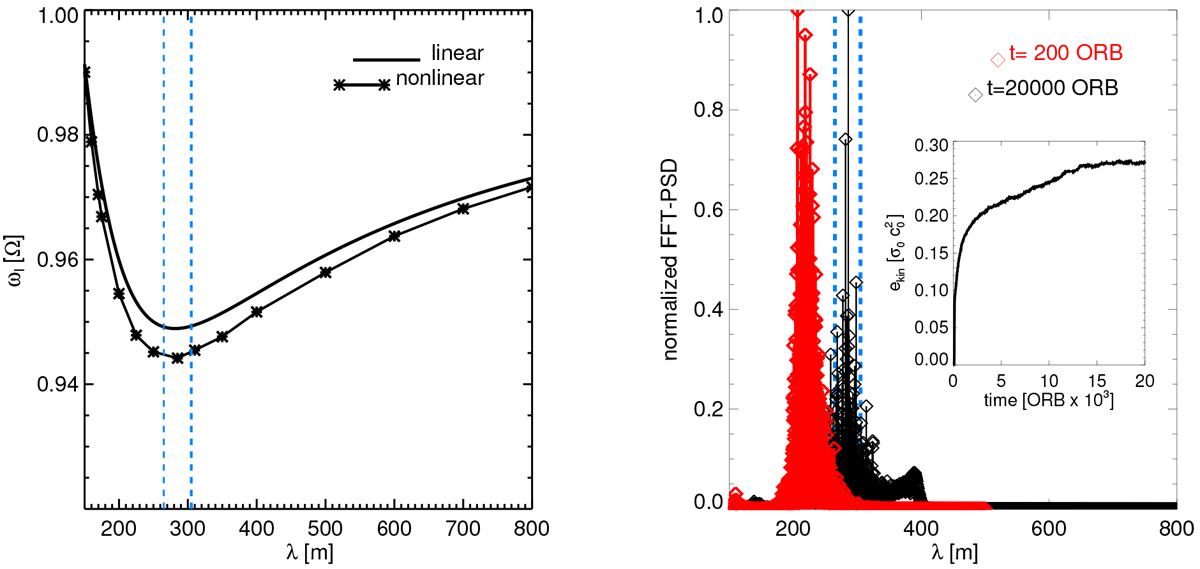
Left panel: linear and nonlinear frequencies of overstable waves adopting the Pr76-parameters with β = 1.25. The linear curve was obtained from numerical solution of Eq. (14). The nonlinear frequencies were obtained from small-domain hydrodynamical integrations of saturated overstable waves as described in detail in LSS2017 (see their Sect. 6.1). The minima of both curves appear at equal wavelengths, which is a consequence of the ideal gas relation Eq. (6) for the hydrostatic pressure. For more realistic equations of state the nonlinear frequency minimum occurs at larger wavelengths than the linear one (LSS2017). Right panel: power spectral density of τ from the same integration as in Fig. 7 during the linear growth phase (t = 200 ORB) and in the saturated state (t ~ 20 000 ORB) of viscous overstability. The insert displays the evolution of the kinetic energy density (Eq. (22)). The blue dashed linesin both panels indicate the expected nonlinear saturation wavelength of viscous overstability with margins ± 20 m (see the text).
Current usage metrics show cumulative count of Article Views (full-text article views including HTML views, PDF and ePub downloads, according to the available data) and Abstracts Views on Vision4Press platform.
Data correspond to usage on the plateform after 2015. The current usage metrics is available 48-96 hours after online publication and is updated daily on week days.
Initial download of the metrics may take a while.