Fig. 7
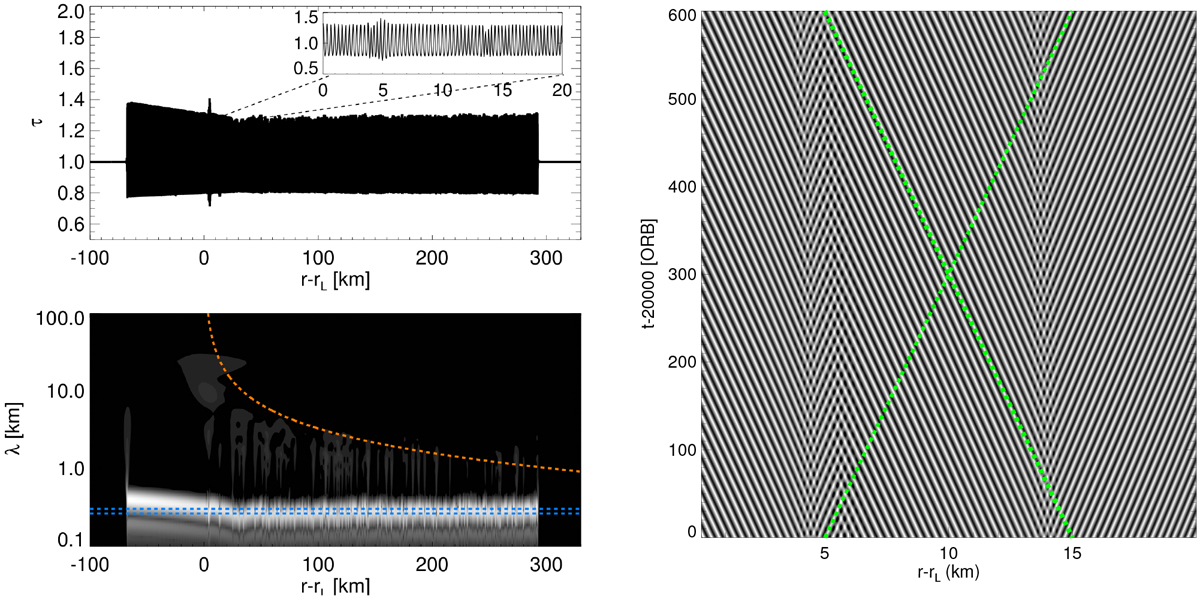
Left panels: radial surface density (τ) profile and its wavelet power at t ~ 20 000 ORB of a hydrodynamical integration using the Pr76-parameters with β = 1.25 and no satellite forcing (![]() ). The short-wavelength structures are due to viscous overstability. The red dashed curve represents the linear density wave dispersion relation (Eq. (43)), which some persistent small amplitude undulations, resulting from the azimuthal derivative terms (Sect. 5), seem to follow. The blue dashed lines indicate the expected nonlinear saturation wavelength of viscous overstability by margins
± 20 m (see thetext). The initial state of the integration is a small amplitude linear combination of left and right traveling linear overstable waves on all wavelengths down to about
200 m. Right panel: stroboscopic space–time diagram showing the evolution near t = 20 000 ORB of a small radial section at the nominal resonance location. Two source structures are located at
x ~ 4 km and x ~ 14 km, respectively, sending out traveling waves both radially inward and outward. In between the sources (at
x ~ 5 km) counter-propagating wave patches collide in a sink. The green dashed lines indicate the expected phase velocity
ωI ∕k
of nonlinear overstable waves, obtained from Fig. 8 (left panel), for a wavelength of
λ = 300 m. Since the space–time diagram is stroboscopic, the apparent phase velocity of the waves in this plot is reduced (in absolute value) by ΩL∕k, compared to the value obtained from the curve in Fig. 8.
). The short-wavelength structures are due to viscous overstability. The red dashed curve represents the linear density wave dispersion relation (Eq. (43)), which some persistent small amplitude undulations, resulting from the azimuthal derivative terms (Sect. 5), seem to follow. The blue dashed lines indicate the expected nonlinear saturation wavelength of viscous overstability by margins
± 20 m (see thetext). The initial state of the integration is a small amplitude linear combination of left and right traveling linear overstable waves on all wavelengths down to about
200 m. Right panel: stroboscopic space–time diagram showing the evolution near t = 20 000 ORB of a small radial section at the nominal resonance location. Two source structures are located at
x ~ 4 km and x ~ 14 km, respectively, sending out traveling waves both radially inward and outward. In between the sources (at
x ~ 5 km) counter-propagating wave patches collide in a sink. The green dashed lines indicate the expected phase velocity
ωI ∕k
of nonlinear overstable waves, obtained from Fig. 8 (left panel), for a wavelength of
λ = 300 m. Since the space–time diagram is stroboscopic, the apparent phase velocity of the waves in this plot is reduced (in absolute value) by ΩL∕k, compared to the value obtained from the curve in Fig. 8.
Current usage metrics show cumulative count of Article Views (full-text article views including HTML views, PDF and ePub downloads, according to the available data) and Abstracts Views on Vision4Press platform.
Data correspond to usage on the plateform after 2015. The current usage metrics is available 48-96 hours after online publication and is updated daily on week days.
Initial download of the metrics may take a while.