Fig. 5
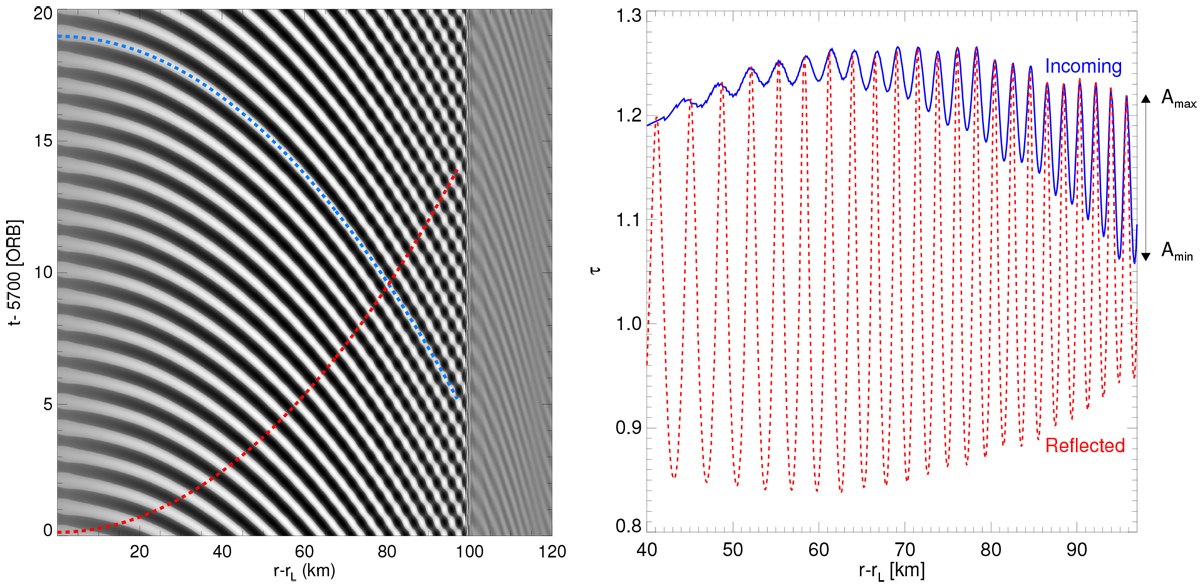
Reflection of a (long) trailing density wave at a sharp boundary at r– rL ~ 100 km where τ0 is reduced by a factor of 1∕5. In the space–time plot (left panel) the blue (red) dashed curve traces a line of equal phase of the incoming (reflected) wave so that it follows a density maximum. Right panel: τ evaluated along these curves. As explained in the text, one can estimate the amplitude ratio of the incoming and the reflected waves from the indicated values Amax and Amin of τ (Eq. (49)). Since the considered wave is weakly nonlinear it follows H(q) ≳1 in the nonlinear dispersion relation (Eq. (44)) so that the linear limit (Eq. (43)) is not fully accurate. To compensate for this we used a slightly increased value of σ0 (by 0.25%) to compute the wavenumber k from Eq. (43), which is used in Eq. (48), to obtain a better fit to the locations of equal phase in the left panel.
Current usage metrics show cumulative count of Article Views (full-text article views including HTML views, PDF and ePub downloads, according to the available data) and Abstracts Views on Vision4Press platform.
Data correspond to usage on the plateform after 2015. The current usage metrics is available 48-96 hours after online publication and is updated daily on week days.
Initial download of the metrics may take a while.