Free Access
Fig. 4
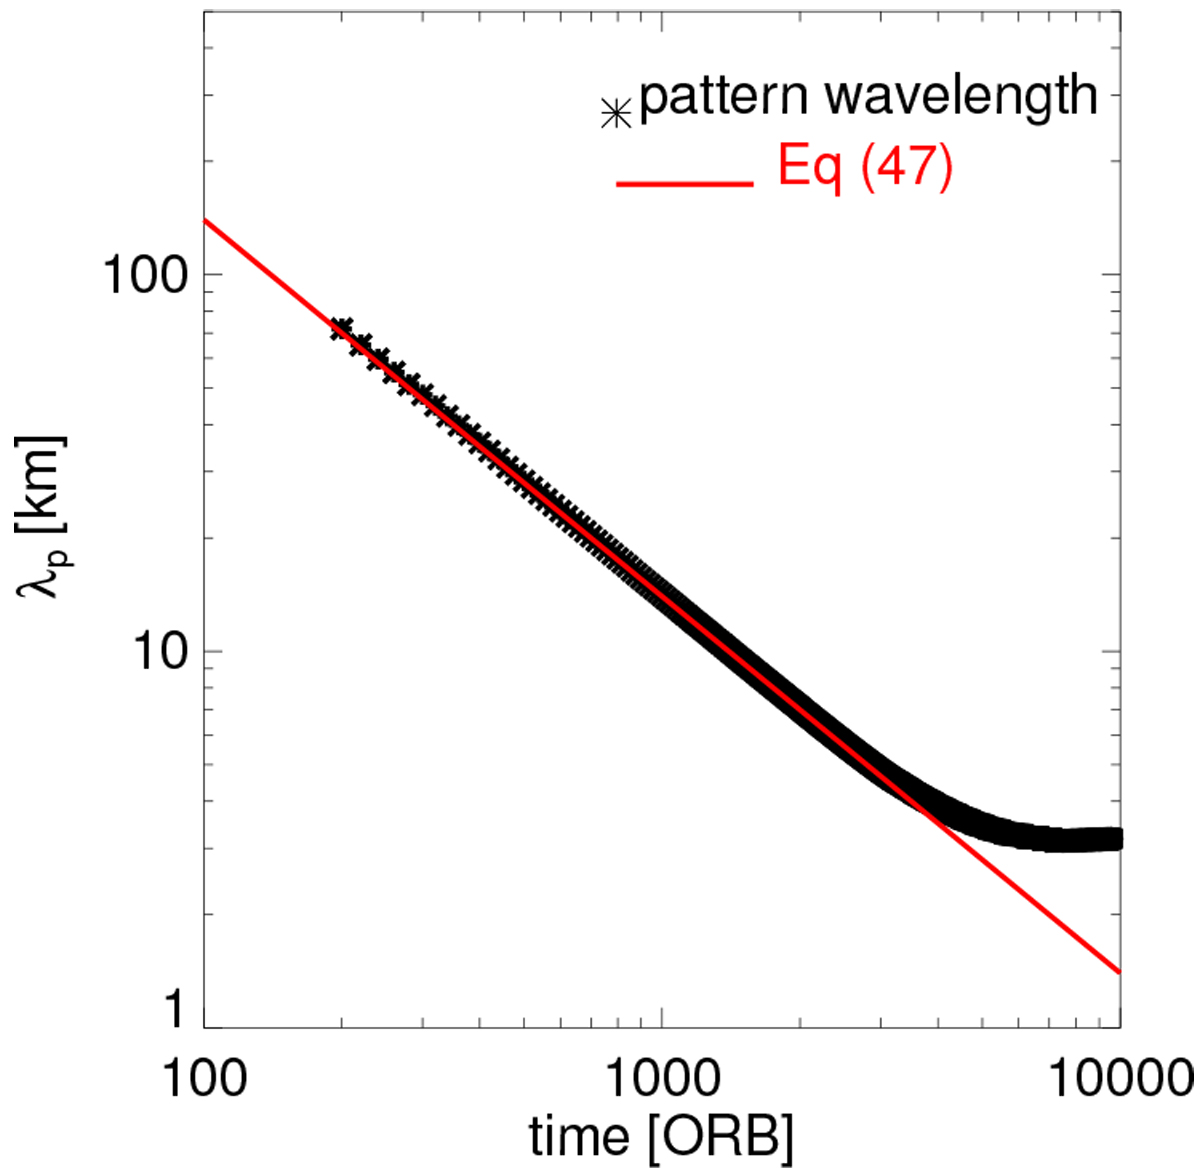
Average wavelength of the forming pattern in the course of the integration shown in Fig. 1. The wavelength is obtained by counting the number of complete wave cycles of the (sinusoidal) surface density τ within the radial region 50 km ≤ r–rL ≤ 150 km.
Current usage metrics show cumulative count of Article Views (full-text article views including HTML views, PDF and ePub downloads, according to the available data) and Abstracts Views on Vision4Press platform.
Data correspond to usage on the plateform after 2015. The current usage metrics is available 48-96 hours after online publication and is updated daily on week days.
Initial download of the metrics may take a while.