Fig. C.3
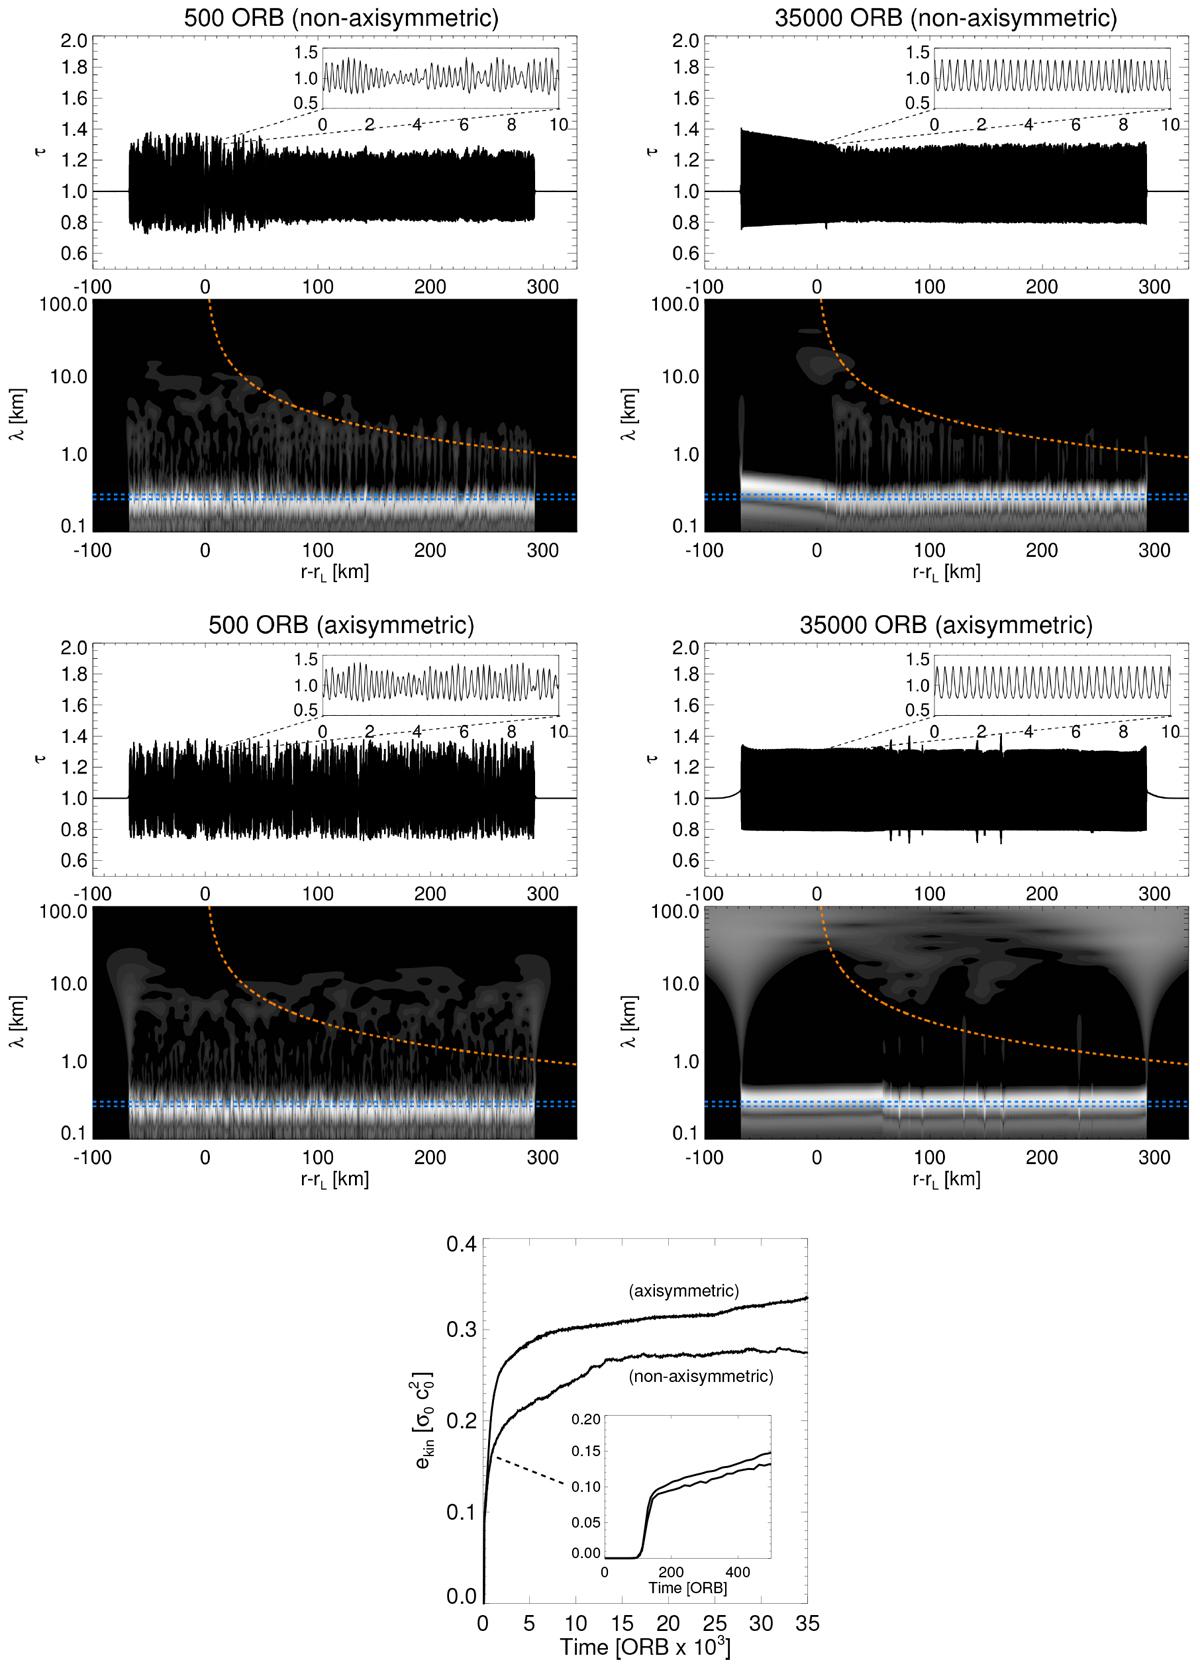
Comparison of the nonlinear evolution of free (Ts = 0) viscous overstability in hydrodynamical integrations with (non-axisymmetric, m = 7) and without (axisymmetric, m = 0) the azimuthal derivative terms (Sect. 5), shown as profiles of the surface density τ along with their wavelet powers for two different times (t = 500 ORB and t =35 000 ORB). The blue dashed lines indicate the expected nonlinear saturation wavelength of axisymmetric (m = 0) viscous overstability by margins ± 20 m (see Sect. 7.4.1). The red dashed curves represent the linear density wave dispersion relation (Eq. (43)). In the axisymmetric case this curve has no physical meaning. The bottom frame displays the evolution ofthe kinetic energy density for both integrations. The insert plot indicates that the linear growth phases (t ≲ 200 ORB) of non-axisymmetric and axisymmetric modes are practically identical, in agreement with our considerations in Sect. 2. The higher saturation energy of the axisymmetric integration is due to the slightly larger saturation wavelength (see Sect. 7.4.1 for explanations).
Current usage metrics show cumulative count of Article Views (full-text article views including HTML views, PDF and ePub downloads, according to the available data) and Abstracts Views on Vision4Press platform.
Data correspond to usage on the plateform after 2015. The current usage metrics is available 48-96 hours after online publication and is updated daily on week days.
Initial download of the metrics may take a while.