Fig. C.2
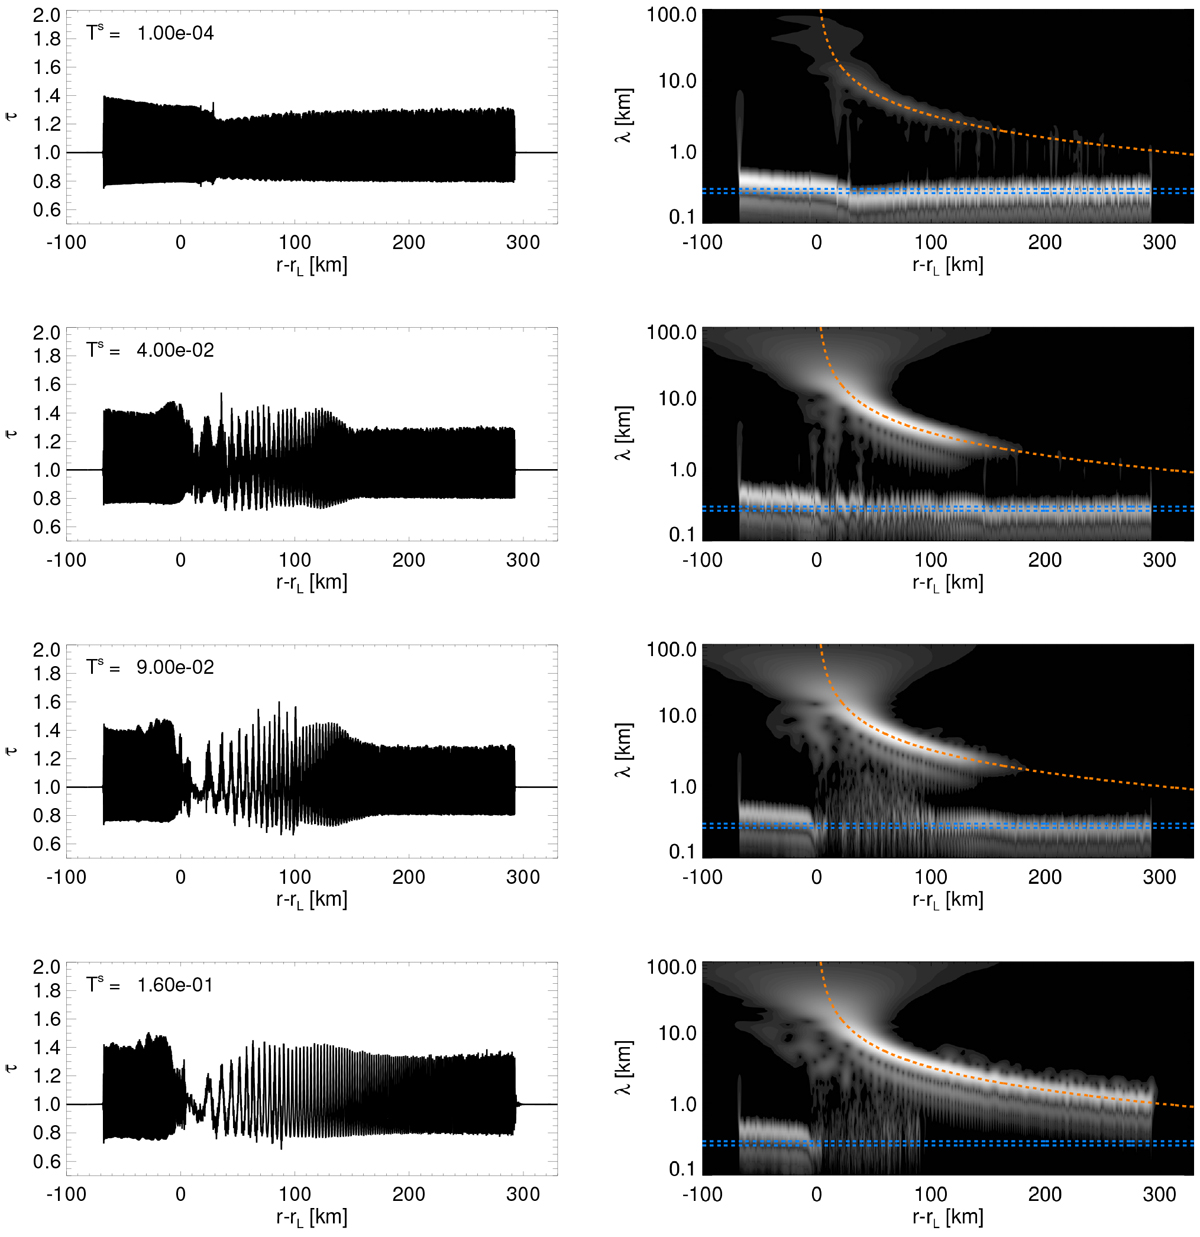
Hydrodynamical integrations using the Pr76-parameters (Table 1) with increasing forcing strength from top to bottom panels
(![]() ). The surface density profiles (left panels) as well as their wavelet powers (right panels) reveal the co-existence of a resonantly forced density wave and short-scale viscous overstability. All integrations use
β = 1.25, a grid of size Lr = 450 km, and resolution h = 25 m. As in Fig. 7, the blue dashed lines indicate the wavelength of vanishing nonlinear group velocity of overstable waves (by margins ± 20 m). The plots correspond to times t ≳ 20 000 ORB.
). The surface density profiles (left panels) as well as their wavelet powers (right panels) reveal the co-existence of a resonantly forced density wave and short-scale viscous overstability. All integrations use
β = 1.25, a grid of size Lr = 450 km, and resolution h = 25 m. As in Fig. 7, the blue dashed lines indicate the wavelength of vanishing nonlinear group velocity of overstable waves (by margins ± 20 m). The plots correspond to times t ≳ 20 000 ORB.
Current usage metrics show cumulative count of Article Views (full-text article views including HTML views, PDF and ePub downloads, according to the available data) and Abstracts Views on Vision4Press platform.
Data correspond to usage on the plateform after 2015. The current usage metrics is available 48-96 hours after online publication and is updated daily on week days.
Initial download of the metrics may take a while.