Fig. B.1
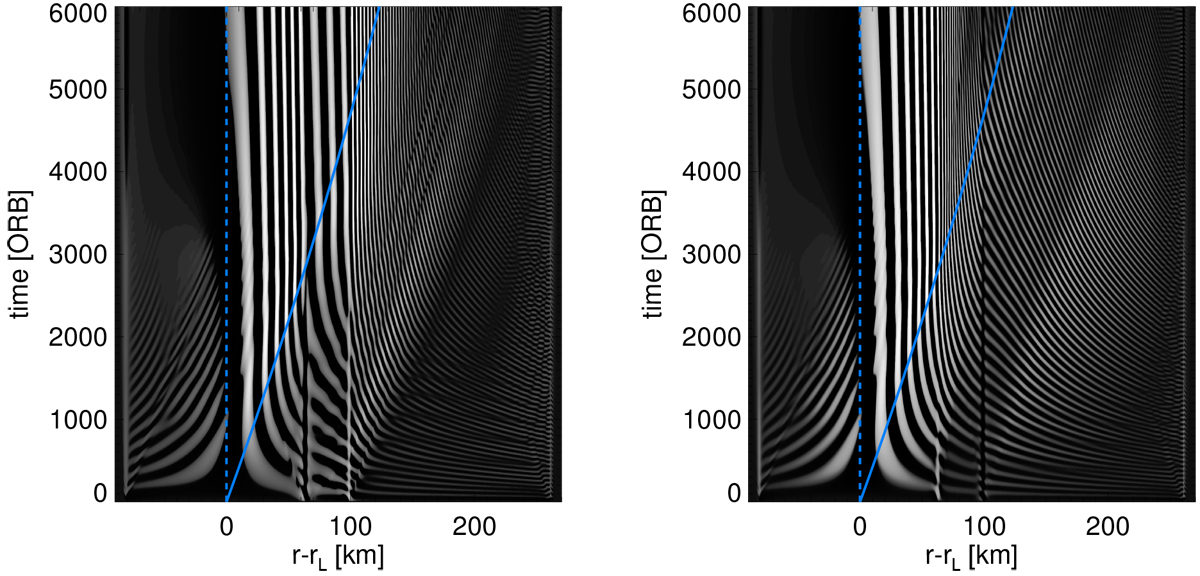
Space–time plots of an m = 7 density wavewith scaled torque ![]() passing through a region (r–rL ~ 60–100 km) of increased (τ0 = 3,
left panel) and decreased (τ0 = 0.5,
right panel) equilibrium surface mass density. As in Figs. 1–3 the blue solid curve indicates the expected curve of the density wavefront in a homogeneous ring (Eq. (42)). These plots only show the density perturbation on top of the background density.
passing through a region (r–rL ~ 60–100 km) of increased (τ0 = 3,
left panel) and decreased (τ0 = 0.5,
right panel) equilibrium surface mass density. As in Figs. 1–3 the blue solid curve indicates the expected curve of the density wavefront in a homogeneous ring (Eq. (42)). These plots only show the density perturbation on top of the background density.
Current usage metrics show cumulative count of Article Views (full-text article views including HTML views, PDF and ePub downloads, according to the available data) and Abstracts Views on Vision4Press platform.
Data correspond to usage on the plateform after 2015. The current usage metrics is available 48-96 hours after online publication and is updated daily on week days.
Initial download of the metrics may take a while.