Fig. 14
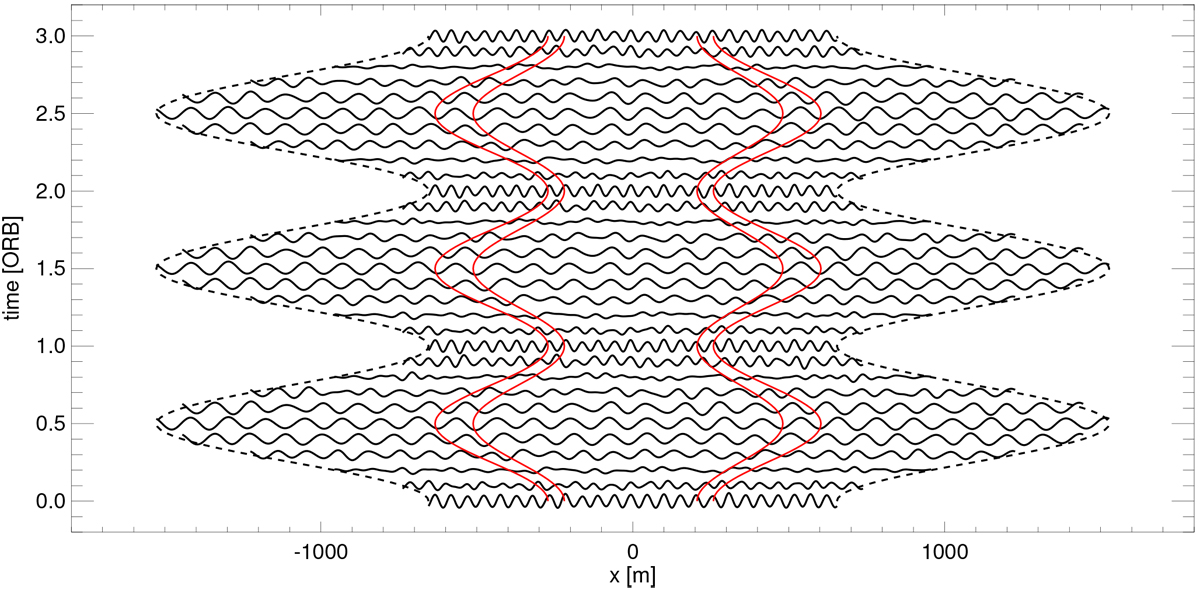
Evolution of the radial velocity perturbation u′ during the first three orbital periods of the N-body simulation with n = 25 and q = 0.4 of Fig. 13. Clearly visible is the periodic variation of the radial size of the simulation region according to Eq. (68) which is drawn as dashed curves. Also indicated is the analogous radial variation of one wavelength of the seeded mode, represented by the two pairs of red solid curves. Since the seed is a standing wave, its amplitude undergoes an oscillation with twice the overstable wave frequency (cf. Eq. (15)).
Current usage metrics show cumulative count of Article Views (full-text article views including HTML views, PDF and ePub downloads, according to the available data) and Abstracts Views on Vision4Press platform.
Data correspond to usage on the plateform after 2015. The current usage metrics is available 48-96 hours after online publication and is updated daily on week days.
Initial download of the metrics may take a while.