Fig. 12
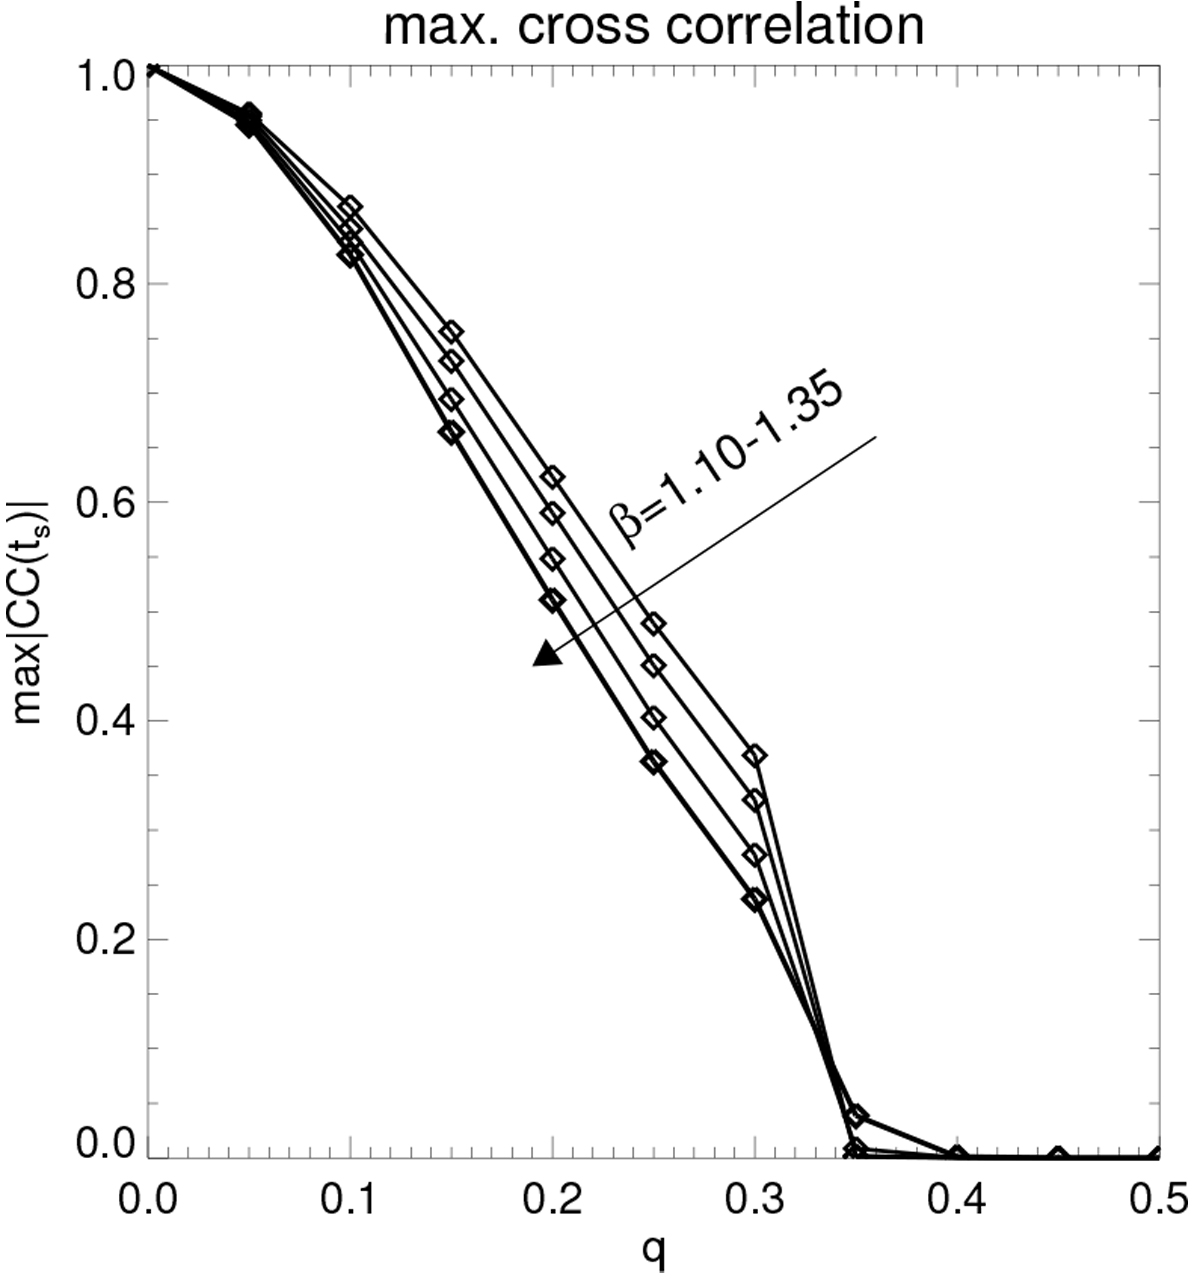
Curves showing the maximum absolute value of the cross correlation of the quantities M31 τ′ and M32u′ (Eq. (67)) associated with an overstable mode with λ = 200 m for different values of q, and the values of β used for the plots in Fig. 11. The arrow indicates the direction of increasing β. The monotonic decrease of these curves with increasing q is the reason why the growth rates of overstable modes (Fig. 11) become smaller with increasing q. All curves have been normalized to yield unity for q = 0.
Current usage metrics show cumulative count of Article Views (full-text article views including HTML views, PDF and ePub downloads, according to the available data) and Abstracts Views on Vision4Press platform.
Data correspond to usage on the plateform after 2015. The current usage metrics is available 48-96 hours after online publication and is updated daily on week days.
Initial download of the metrics may take a while.