Fig. 10
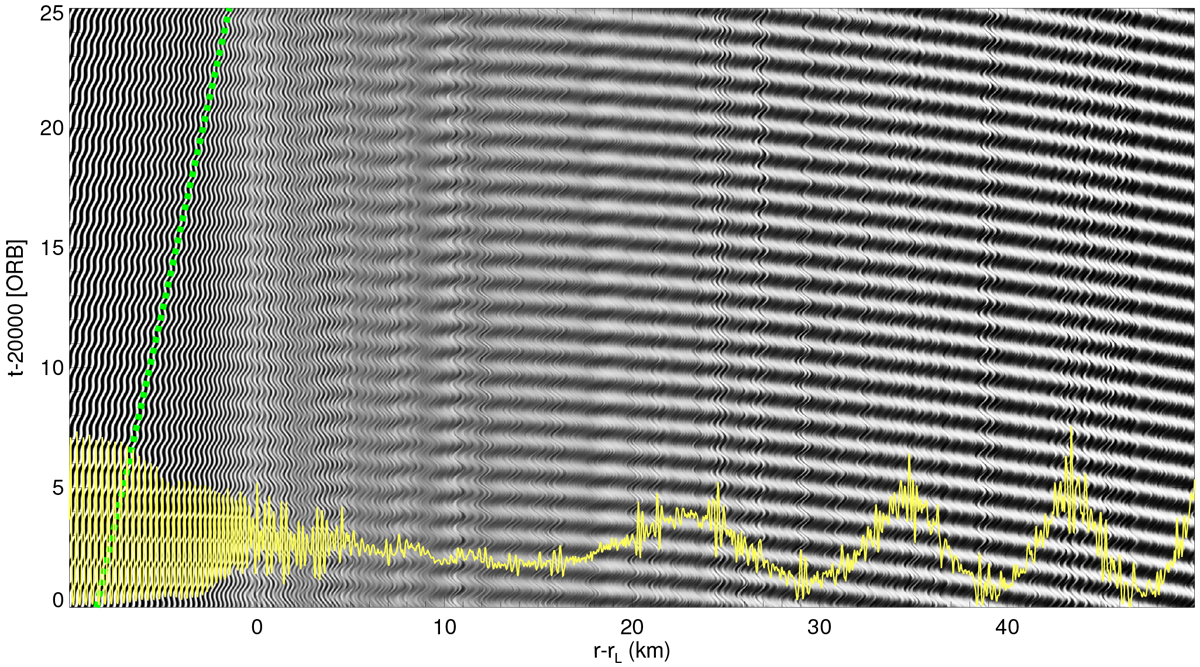
Orbit-resolved space–time diagram of τ for a region near the density wave resonance resulting from the integration shown in Fig. C.1 with β = 1.20 for times t ≳ 20 000 ORB. The nearly horizontal pattern that becomes increasingly pronounced with increasing r > rL represents the density wave. The smaller scale structures are overstable waves that are perturbed by the satellite resonance, causing the “wiggles” in their appearance, in contrast to the waves displayed in Fig. 7. The green dashed line is the expected phase speed ωI ∕k of (unperturbed) overstable waves with λ = 300 m obtained from Fig. 8. A profile of τ is drawn forthe time indicated by the arrow, showing how the amplitude of overstable waves is reduced in approaching the resonance from smaller radii. Visible as well are the first wave cycles of the density wave.
Current usage metrics show cumulative count of Article Views (full-text article views including HTML views, PDF and ePub downloads, according to the available data) and Abstracts Views on Vision4Press platform.
Data correspond to usage on the plateform after 2015. The current usage metrics is available 48-96 hours after online publication and is updated daily on week days.
Initial download of the metrics may take a while.