Fig. 1
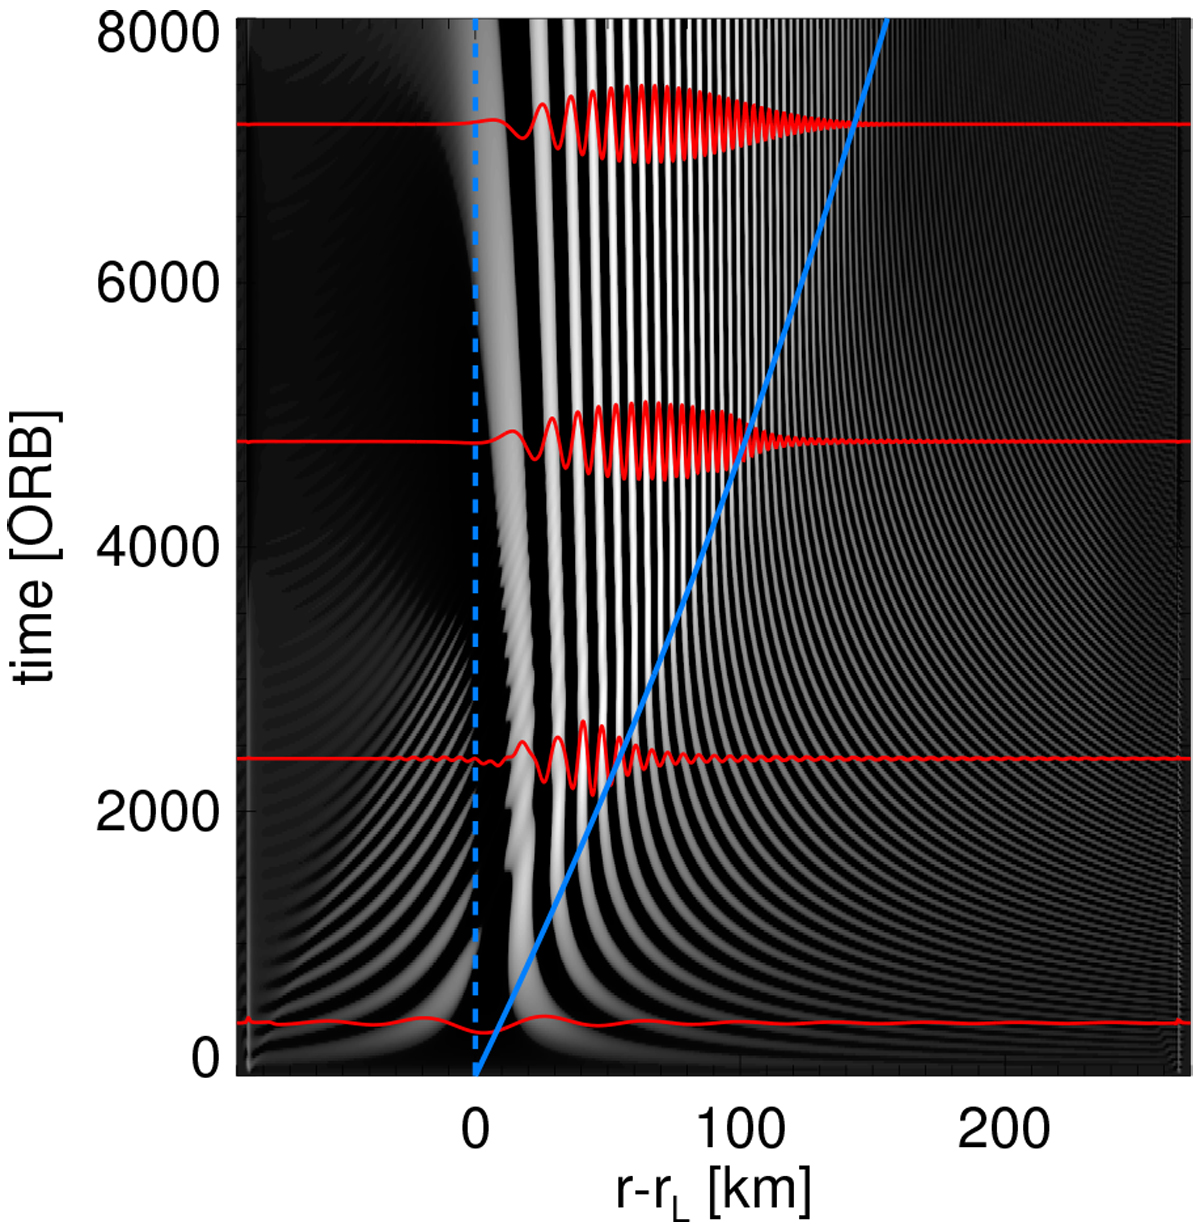
Stroboscopic space–time diagram showing the evolution of the scaled surface density
τ
for an integration with the Pr76-parameters and an associated scaled torque ![]() . Brighter regions correspond to larger τ-values. The blue solid line marks the path of a signal traveling with the linear group velocity (Eq. (42)) starting from resonance r = rL
at time t = 0. Also shown are profiles of τ
at different stages of the evolution. Due to the plot being stroboscopic, the density wave pattern eventually becomes stationary as the oscillation with frequency
ωs = −ΩL
is effectivelyremoved.
. Brighter regions correspond to larger τ-values. The blue solid line marks the path of a signal traveling with the linear group velocity (Eq. (42)) starting from resonance r = rL
at time t = 0. Also shown are profiles of τ
at different stages of the evolution. Due to the plot being stroboscopic, the density wave pattern eventually becomes stationary as the oscillation with frequency
ωs = −ΩL
is effectivelyremoved.
Current usage metrics show cumulative count of Article Views (full-text article views including HTML views, PDF and ePub downloads, according to the available data) and Abstracts Views on Vision4Press platform.
Data correspond to usage on the plateform after 2015. The current usage metrics is available 48-96 hours after online publication and is updated daily on week days.
Initial download of the metrics may take a while.