Fig. 8.
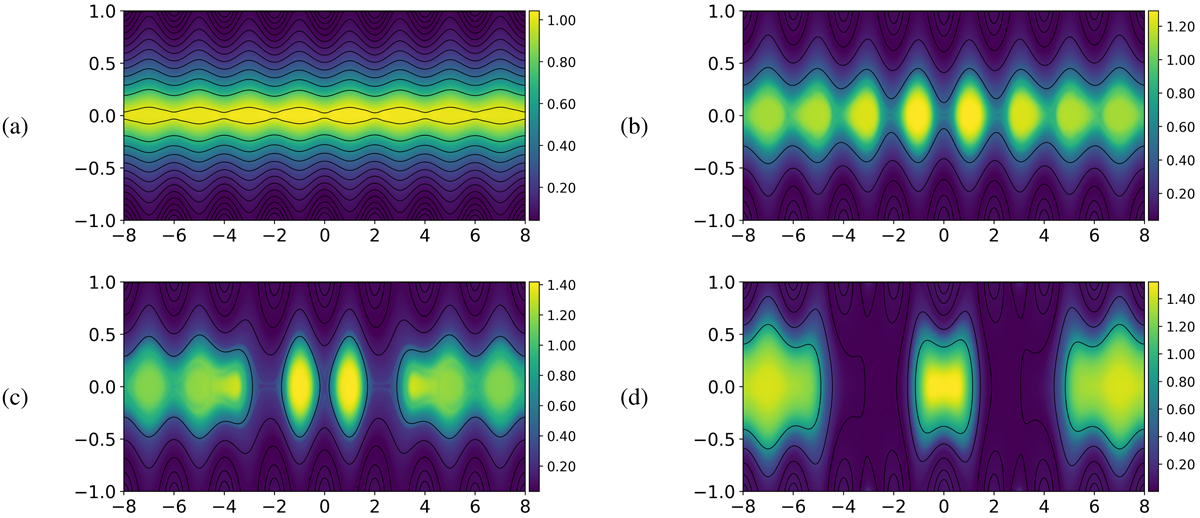
Panels a–d: B and Bz for case 2b (multiple wavelengths λ1 = 2.0, λ2 = 16.0, with increased amplitude on the smaller wavelength component such that δ1 = 0.35) at time t = 8, 20, 28 and 350τA. The simulation reaches its final state much more rapidly than in case 2a due to the increased total flux. Bz was chosen to be displayed rather than Jz since, in this case, the island structure was more visible.
Current usage metrics show cumulative count of Article Views (full-text article views including HTML views, PDF and ePub downloads, according to the available data) and Abstracts Views on Vision4Press platform.
Data correspond to usage on the plateform after 2015. The current usage metrics is available 48-96 hours after online publication and is updated daily on week days.
Initial download of the metrics may take a while.