Fig. 3.
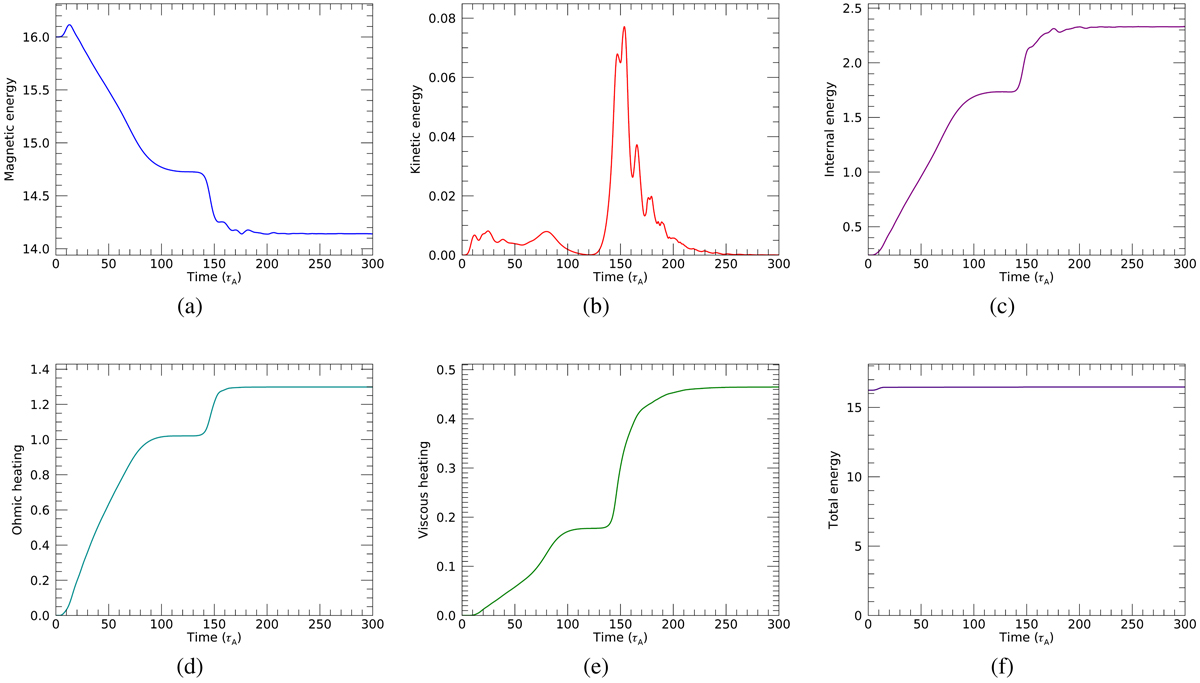
Energetics for case 1b (Table 1), with corresponding MHD fields shows in Fig. 4. At around 100tA, the first stage of reconnection is slowing to a halt as islands reach saturation. At around 150tA the large drop in magnetic energy (panel a) and spike in kinetic energy (panel b) correspond to the island coalesence event seen in Fig. 4 (panels e–f). The total energy is shown as an indication of numerical accuracy over the course of the simulation: the small initial rise is due to the driving at the boundary, remaining constant thereafter (observed in all simulations, witihin 5%).
Current usage metrics show cumulative count of Article Views (full-text article views including HTML views, PDF and ePub downloads, according to the available data) and Abstracts Views on Vision4Press platform.
Data correspond to usage on the plateform after 2015. The current usage metrics is available 48-96 hours after online publication and is updated daily on week days.
Initial download of the metrics may take a while.