| Issue |
A&A
Volume 623, March 2019
|
|
|---|---|---|
| Article Number | C1 | |
| Number of page(s) | 2 | |
| Section | Planets and planetary systems | |
| DOI | https://doi.org/10.1051/0004-6361/201833435e | |
| Published online | 25 February 2019 | |
The “memory” of the Oort cloud (Corrigendum)
1
LAL-IMCCE, Observatoire de Paris, PSL Research University, CNRS, Sorbonne Universités, UPMC Univ. Paris 06, Univ. Lille., 1 Impasse de l’Observatoire, 59000 Lille, France
e-mail: marc.fouchard@univ-lille1.fr
2
RISE Project Office, National Astronomical Observatory of Japan, 2-12 Hoshigaoka-cho, Mizusawa, Iwate 023-0816, Japan
3
CfCA, NAOJ, Mitaka, Tokyo 181-8588, Japan
Key words: comets: general / Oort Cloud / errata, addenda
The q axes of Figs. 1 and 3 are oriented downward, whereas they should be oriented upward. The figures themselves are correct, only the orientation of the axes is wrong.
© ESO 2019
All Figures
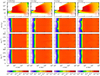 |
Fig. 1 From top to bottom panels: distribution of comets in (a, q), (a, cos (iE), (a, ωG) and (a, ΩG) planes at four different epochs t = 250 Myr and 1, 2 and 4 Gyr. For visibility, the bin sizes are constant along any axis. However the density function is computed in number of comets per au for the perihelion distance and per au−1 for the semi-major axis. The data comes from the evolution of the I0 proto-Oort cloud. |
| In the text | |
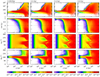 |
Fig. 3 As Fig. 1 but for the D0 proto-Oort cloud. |
| In the text | |
Current usage metrics show cumulative count of Article Views (full-text article views including HTML views, PDF and ePub downloads, according to the available data) and Abstracts Views on Vision4Press platform.
Data correspond to usage on the plateform after 2015. The current usage metrics is available 48-96 hours after online publication and is updated daily on week days.
Initial download of the metrics may take a while.